Bottom line first. For an electrolyzer that has to take renewable output variation directly, PEM is the least troublesome; alkaline is constrained at the bottom of the swing, and SOEC by the swing itself. The reason is not the stack response speed people usually cite. Alkaline units have to manage hydrogen concentration in the oxygen stream at low load, which pins the minimum load, and SOEC has to stay hot, so heating power keeps flowing even when output drops to zero. The default split is PEM for a variable source, alkaline for baseload power, and SOEC only when cheap high-temperature heat sits next door.
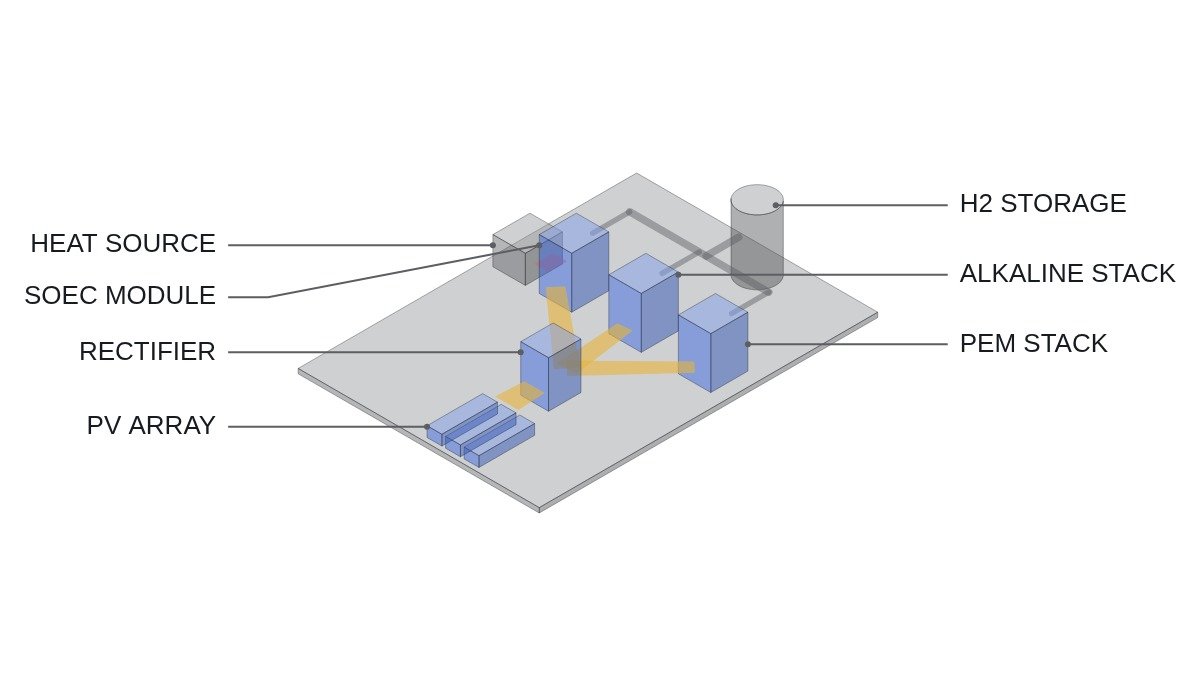
Structure and operating window of the three types
Alkaline electrolysis uses a potassium hydroxide (KOH) solution and a diaphragm and runs at roughly 60-90 °C. It depends little on precious-metal catalysts and has the longest scale-up history. PEM electrolysis uses a polymer electrolyte membrane in a similar temperature band, with platinum on the cathode and iridium-based catalyst on the anode. SOEC splits steam with a ceramic electrolyte at roughly 700-850 °C.
The electrochemical baseline is the same for all three. One kilogram of hydrogen is about 496 mol and needs 992 mol of electrons, a charge of about 26,590 Ah. At a cell voltage V, stack energy is about 26.59 × V kWh/kg. At the thermoneutral voltage of 1.48 V that is 39.4 kWh/kg, equal to hydrogen’s HHV; assumption: at a cell voltage of 1.9 V it is about 50.5 kWh/kg. SOEC’s advantage at high temperature is that part of the reaction energy can be supplied as heat instead of electricity.
| Item | Alkaline | PEM | SOEC |
|---|---|---|---|
| Electrolyte | KOH solution | Polymer membrane | Ceramic |
| Operating temp. | approx. 60-90 °C | approx. 50-80 °C | approx. 700-850 °C |
| Catalyst | Mainly nickel-based | Platinum, iridium | Ceramic, nickel-based |
| Variability | Low-end limit | Widest | Heat-keeping limit |
| Burden when idle | Re-heat on restart | Small | Constant heating power |
| Maturity | Highest | High | Mostly demonstration |
Read the variability and idle-burden rows together. With a variable source the problem is not the moment output ramps up but the moment it falls to the floor. At that moment alkaline units must stop because of the gas purity interlock, and SOEC must keep heating even while stopped. Only PEM carries a relatively small burden at the floor.
Where it wins, where it doesn’t
Alkaline — baseload or smoothed power
Current condition: a site with steady input, such as grid power or power smoothed by an ESS. After deployment: large stacks run near rating for long hours, so the cost and maturity advantages hold. Connecting logic: at low load, production falls while gas crossing the diaphragm does not fall nearly as much, so hydrogen concentration in the oxygen rises. As it approaches the safety limit the unit must trip on interlock, so a source that frequently drops to the floor means more stop-restart cycles.
PEM — direct coupling to solar or wind
Current condition: a site taking renewable output directly, without smoothing. After deployment: the wide load range and fast response turn most of the variable power into hydrogen. Connecting logic: the precious-metal catalysts and membrane raise equipment cost, and how frequent load changes affect membrane and catalyst degradation depends on operating history. Degradation rates must be confirmed with manufacturer data and field measurement.
SOEC — sites with a high-temperature heat source next door
Current condition: a site that can take waste heat or steam from a nuclear plant or an industrial process. After deployment: supplying part of the reaction energy as heat gives the lowest power consumption per kg. Connecting logic: ceramic cells dislike repeated heat-up and cool-down, so they must be held in hot standby even at zero output. Attached to a variable source, they draw heating power during hours with no production, and the power consumption advantage erodes quickly.
Recommended setup by power source
| Power source | Recommended | Reason |
|---|---|---|
| Solar, direct | PEM | Zero-output period every day |
| Wind, direct | PEM or mixed | Irregular low-output periods |
| Renewable + ESS smoothing | Alkaline | ESS absorbs the low end |
| Grid baseload | Alkaline | Cost and maturity |
| High-temp heat on site | SOEC | Heat cuts power use |
| Large hybrid complex | Alkaline + PEM | Split base and variable share |
The last row is the answer that comes up most in practice. Let alkaline take the base share of renewable output near its rating and let PEM take only the variable share above it, and both the alkaline low-end limit and the PEM cost burden shrink at once. The split point has to come from the site’s output distribution (hourly output duration curve); there is no general value.
Which way efficiency moves at part load
Treating variable operation purely as an efficiency loss leads to the wrong conclusion. For the stack alone, lower current density means lower overpotential and lower cell voltage, so energy per kg actually falls. Assumption: rated cell voltage 1.9 V, part-load cell voltage 1.7 V. By the formula above, consumption drops from about 50.5 kWh/kg to about 45.2 kWh/kg.
Balance-of-plant works the other way. Circulation pumps, cooling, gas purification and rectifier standby losses are partly fixed regardless of output, so their share per kg grows as load falls. System efficiency often peaks at an intermediate load where stack efficiency and fixed losses balance, and where that band lies must be read from each product’s part-load curve. With variable sources, a common approach is to control how many stacks run so that each stays in that optimal band as long as possible.
Decision sequence
- Obtain the hourly output duration curve of the input source and count the annual hours spent in low output relative to rating.
- Confirm each candidate’s minimum load and the gas purity interlock conditions at that load from manufacturer data.
- Compare handling the low-output hours by stopping, by filling them with ESS, or by taking them with PEM.
- For SOEC candidates, first confirm hot standby heating power and the continuity of the heat supply.
- Rectifier power factor and harmonics at part load differ by installation; leave them as items that require waveform analysis and field measurement, and feed them into the interconnection review.
Items to verify
- Minimum load ratio per product and the alarm/trip settings for hydrogen-in-oxygen concentration at low load
- System power consumption (kWh/kg) and part-load efficiency curve per product
- Degradation data for PEM membranes and catalysts under load-cycling history
- SOEC hot standby heating power and allowable thermal cycles
- Scope of safety standards for water-electrolysis hydrogen generators (such as ISO 22734)
Boundary conditions
This split reverses under some conditions. First, when the input can be adequately smoothed with an ESS. Variability response then drops out of the criteria, and alkaline, ahead on cost and maturity, overtakes PEM. Whether the ESS costs less than the equipment cost difference between electrolyzer types needs a separate calculation.
Second, when product improvements bring the alkaline minimum load down far enough. With pressurized designs or improved diaphragms lowering the floor, stop counts fall even on direct solar coupling. Third, when the heat source next to an SOEC is continuous and the power is baseload. Under that condition SOEC’s heat-keeping weakness vanishes and only its per-kg power advantage remains.
The single selection rule: first count how many hours a year the input power falls below minimum load; if those hours are many, choose PEM; if they are few or the input is smoothed, choose alkaline; choose SOEC only when a high-temperature heat source and baseload power come together.