The conclusion first. Immediate localization pays off only in the range where the cost gap created by tariffs exceeds the sum of logistics savings and IRA tax credits. Below that range, keeping a produce-in-Korea-and-export model is the better position.
How the 25% tariff changed the equation
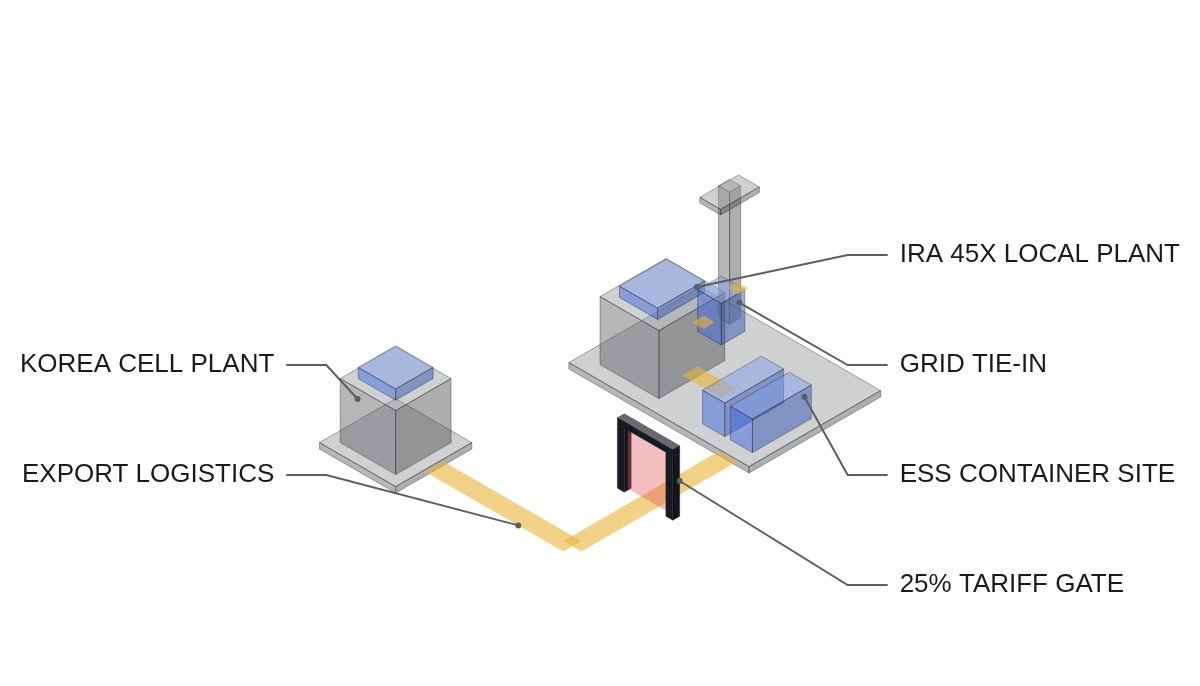
The US tariff on ESS batteries was raised from 7.5% to 25% for Chinese-made products and has been in effect since January 1, 2026. Over the same period, Korea’s ESS battery industry has been accelerating its push into North America and its efforts to secure funding for capacity expansion and investment. On the surface, the tariff increase improves the relative price competitiveness of Korean-made products, but whether to take that improvement as profit or reinvest it in a shift to local production is a separate decision.
Where it wins — shifting to local production
Current condition: As the tariff gap between Korean-made and Chinese-made products has widened, the price competitiveness of exports to the US has improved in relative terms.
Change after application: If that improvement is reinvested in local production, Inflation Reduction Act (IRA) tax credits (the Advanced Manufacturing Production Credit, 45X, and others) can be layered on top, improving margins further.
Connecting logic: In the range where the tariff-avoidance effect and the tax-credit effect work at the same time, localization can hold a total-cost advantage over domestic production.
Where it doesn’t — keeping domestic production and exports
On the other hand, shifting to local production carries entry barriers: initial CAPEX, workforce recruitment, and the lead time for grid interconnection permitting. Interconnection permitting for a new US plant in particular can take anywhere from several months to more than a year, depending on distributed-energy procedures and local grid conditions, so for short-term demand the existing domestic production setup is the better fit.
Comparison table
| Item | Shift to US production | Keep Korean production + export |
|---|---|---|
| Tariff burden | None | Tariff on Korean-made applies (lower than China) |
| IRA tax credits | Eligible | Not applicable |
| Initial CAPEX | High | Low (existing facilities) |
| Interconnection lead time | Several months to 1+ year | N/A |
| FX risk | Low (local-currency revenue) | Present |
As the table shows, localization looks favorable once tax credits are layered on, but what ultimately governs the payback period is the stability of policy.
The factory is also a large electrical load
From the power-systems side, one line in the table deserves more weight than it usually gets: interconnection lead time. A cell or module plant is not only a supplier of ESS equipment; it is itself a large, continuous industrial load. Formation and aging, dry rooms and process utilities run around the clock, and the plant cannot start production until its own service connection, main substation and protection scheme are energized.
That makes the interconnection permit a schedule item on the critical path, not an administrative step. Construction of the building and delivery of the process line can run in parallel, but neither produces a cell until the plant receives power at its full service capacity. When the article says permitting can take several months to more than a year, that range sits directly on top of the CAPEX payback clock: the money is spent, but the payback period has not started.
The export model avoids this entirely. The Korean plant is already connected, its protection and power quality are already proven, and additional output requires no new utility agreement. This is the equipment-side reason why the existing domestic setup is the better fit for short-term demand.
Character comparison of the decision factors
| Factor | Favors | Set by | Policy sensitivity |
|---|---|---|---|
| Tariff burden | Local production (no tariff) | Trade policy | High |
| IRA tax credits (45X etc.) | Local production | US legislation and guidance | High |
| Logistics savings | Local production | Distance and freight market | Low |
| Initial CAPEX | Export model | Company decision | Low once committed |
| Interconnection lead time | Export model | Local utility and grid conditions | Medium |
| FX risk | Local production | Currency markets | Low |
The table separates the factors that pull toward localization into two groups. The ones that rest on policy — tariffs and tax credits — are the largest and the least stable. The ones that rest on physics and markets — logistics and FX — are smaller but durable. A localization case built mainly on the first group is exposed to exactly the risk the boundary conditions below describe.
Decision order
- Calculate the gap in the article’s terms. Compare the cost gap created by the tariff with logistics savings plus IRA tax credits. If the gap does not exceed the sum, stop here and keep exporting.
- Put interconnection on the schedule first. Before committing CAPEX, confirm with the local utility how long service connection at the required plant capacity will take. Treat the answer as the start date of production, not a footnote.
- Measure the payback period against policy cycles. Compare the CAPEX payback period with the expected interval between trade negotiations or changes of administration.
- Check what survives if the credits disappear. Rerun the case with tariffs and credits removed. What remains — logistics and FX — is the floor of the localization case.
- Keep the export path warm. Until local production is stable, domestic capacity is the hedge against both permitting delays and policy reversal.
Frequently asked questions
Q. Who does the 25% US tariff on ESS batteries apply to?
It applies to Chinese-made ESS batteries, raised from 7.5% to 25% and in effect since January 1, 2026. Korean-made products are subject to a separate tariff rate, so their relative price competitiveness has improved.
Q. Under what conditions does shifting to local production become favorable?
When the cost gap caused by tariffs exceeds the sum of logistics savings and IRA tax credits (45X and others). Below that range, producing in Korea and exporting is more favorable.
Q. What is the biggest risk?
Policy volatility. If tariff rates and tax-credit conditions change on a cycle shorter than the CAPEX payback period (typically 3–5 years), the advantage of localization flips.
Boundary conditions — where the advantage flips
Tariff rates and IRA tax-credit conditions can be readjusted through trade negotiations or a change of administration. If policy changes on a cycle shorter than the localization CAPEX payback period (typically 3–5 years), the advantage of localization flips. The final selection criterion is therefore: “Is the change cycle of tariff and tax-credit policy longer than the CAPEX payback period?” Immediate localization is favorable only when this condition holds.
The comparison above sets policy cycles against the payback period, but when the payback clock actually starts can also flip the decision. If a site with an already energized service connection is secured, or capacity is added next to an existing plant, the interconnection lead-time penalty disappears and the case tilts toward localization. Conversely, even with stable policy, if the local utility cannot deliver the required service capacity on time, the payback period starts at energization rather than at the investment date, and the advantage of localization shrinks. The single selection criterion is therefore: is the change cycle of tariff and tax-credit policy longer than the CAPEX payback period counted from the date grid interconnection is completed?
References: Nate News, “K-batteries step up North America push… accelerating ESS capacity expansion and investment funding” (2026-08-23); IT Insight, “ESS battery shipments up 71% in the first half of 2026” (2026)