Bottom line first. When choosing between ammonia cracking and liquid hydrogen to bring imported hydrogen to a stationary fuel cell plant, shipping distance is not the first thing to check. The hydrogen purity demanded by the final consuming equipment, and the storage period, come first. Ammonia carries more hydrogen per unit volume and stores for long periods at ambient temperature under pressure or at about -33 °C, but turning it back into hydrogen takes heat for cracking and a purification step to strip residual ammonia. Liquid hydrogen arrives at high purity, but must be held at about -253 °C and keeps boiling off in storage. For PEM-type equipment that needs high purity, liquid hydrogen wins; for equipment that can accept ammonia, such as high-temperature fuel cells or co-firing, ammonia wins.
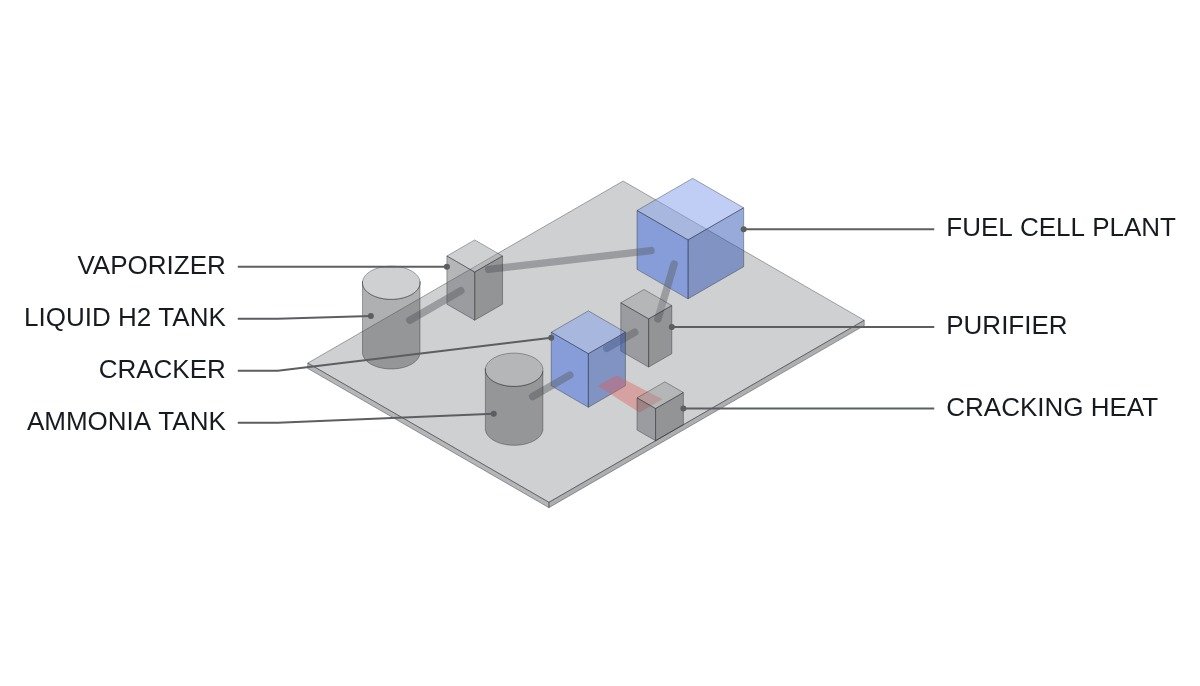
The two paths by physical properties
Density as a hydrogen carrier can be compared by calculation. Liquid hydrogen has a density of about 71 kg/m3. Liquid ammonia has a density of about 682 kg/m3 and a hydrogen mass fraction of 3 × 1.008 ÷ 17.03 ≈ 17.8%, so one cubic metre holds about 121 kg of hydrogen. For the same tank volume, ammonia carries about 1.7 times as much hydrogen as liquid hydrogen.
In exchange, ammonia pays to be turned back at the destination. The reaction 2NH3 → N2 + 3H2 is endothermic; taking the reaction enthalpy as about 46 kJ per mole of ammonia, producing 1 kg of hydrogen (about 496 mol) takes about 331 mol of ammonia and about 15.2 MJ (about 4.2 kWh) of reaction heat. That is about 13% of hydrogen’s LHV of 33.3 kWh/kg, before adding the heat to bring the feed up to reaction temperature and losses from unconverted feed. On the liquid hydrogen side, the liquefaction power is spent first, at the origin.
| Item | Ammonia cracking | Liquid hydrogen |
|---|---|---|
| Storage condition | approx. -33 °C or ambient under pressure | approx. -253 °C |
| H2 density | approx. 121 kg/m3 | approx. 71 kg/m3 |
| Main energy loss at | Destination (cracking heat) | Origin (liquefaction power) |
| Storage loss | Small | Continuous boil-off |
| Purity on arrival | Needs purification | High |
| Main hazard | Toxicity | Cryogenic, flammable |
| Existing infrastructure | Fertilizer/chemical trade network | Limited |
The rows a power plant engineer should read first are “main energy loss at” and “purity on arrival.” With ammonia, losses and equipment burden concentrate at the importing site; with liquid hydrogen, at the exporting site. Whether the importing site has room for a cracking heat source and purification is effectively the first gate.
Where it wins, where it doesn’t
Ammonia cracking
Current condition: a generating plant with waste heat or a high-temperature heat source near the import site, which needs to hold fuel for weeks or longer. After deployment: low storage losses allow seasonal stockpiling, and covering cracking heat with waste heat reduces the roughly 13% reaction-heat burden. Connecting logic: cracked gas contains nitrogen and unreacted ammonia, so the higher the purity the equipment demands, the longer the purification train and the lower the yield.
Liquid hydrogen
Current condition: the final consumer is purity-sensitive PEM-type equipment, and steady demand keeps the storage period short. After deployment: vaporization alone yields high-purity hydrogen, so site equipment stays simple. Connecting logic: boil-off accumulates as storage periods lengthen, so on a site with intermittent consumption part of the delivered hydrogen is lost or has to be reprocessed before it is ever used.
Where the final consumer changes the decision
Ammonia does not always need to go all the way back to pure hydrogen. Configurations in which high-temperature fuel cells take ammonia or partially cracked gas are being researched and demonstrated, and ammonia co-firing is under review for thermal plants. For such consumers the cracking and purification steps can be reduced or skipped, and the weakness of the ammonia path largely disappears. PEM-type equipment, on the other hand, must keep ammonia in the fuel at trace levels, so its purification burden is the heaviest.
| Final consumer | Favoured path | Reason |
|---|---|---|
| PEM-type fuel cell | Liquid hydrogen | High purity, no purification burden |
| SOFC plant | Ammonia | May accept partially cracked gas |
| Ammonia co-fired thermal | Ammonia | No cracking needed |
| Seasonal stockpile | Ammonia | Small storage loss |
| Steady short-term use | Liquid hydrogen | Little boil-off build-up |
The conclusion of the second table is that the path is decided backwards from the last piece of equipment at the import site, not by the shipping leg. Even with both paths landing at the same port, which one wins depends on the power equipment connected to it.
Stockpile size for 1 MW continuous operation
Here is why storage period changes the decision, in numbers. Assumption: 1,000 kW fuel cell in continuous operation, 50% electrical efficiency (LHV), 100% cracking conversion and recovery (ideal). Hydrogen use is 1,000 ÷ (33.3 × 0.5) ≈ 60 kg per hour, about 1.44 t per day. Each kg of hydrogen needs about 5.6 kg of ammonia, so daily ammonia use is about 8.1 t.
A 30-day stockpile is about 43 t of hydrogen: about 610 m3 as liquid hydrogen, or about 243 t, about 357 m3, as liquid ammonia. The tank volume differs, but the bigger difference is how it is kept. 610 m3 of liquid hydrogen must be held at -253 °C for a whole month while its boil-off is handled; 357 m3 of ammonia sits under storage conditions industry already handles. In real plants conversion and purification recovery fall below 100%, so the ammonia requirement rises above this figure.
Decision sequence
- Fix the final consuming equipment and its allowable impurity limits. Whether it can take ammonia directly or only pure hydrogen is the first branch.
- Set the fuel stockpile period. If it runs to weeks or more, calculate liquid hydrogen boil-off loss separately.
- Check the heat source conditions at the import site. Whether cracking reaction heat can come from waste heat changes the loss on the ammonia path.
- Compare toxic gas storage and handling against cryogenic equipment conditions from a site permitting standpoint.
- Put origin liquefaction power and destination cracking heat on the same basis (energy per kg of hydrogen) and sum the losses over the whole chain.
Items to verify
- Actual liquefaction power consumption (kWh/kg) of commercial plants and how it varies with scale
- Daily boil-off rate of liquid hydrogen storage tanks (by capacity and insulation type)
- Actual conversion rate, reaction temperature and post-purification hydrogen recovery of cracking units
- Allowable ammonia concentration per fuel cell type (including the scope of hydrogen fuel quality standards such as ISO 14687)
Boundary conditions
Two conditions reverse this judgement. First, a site where cracking heat must come from burning external fuel. Without waste heat, reaction and preheat energy must be supplied by burning part of the ammonia or hydrogen, and delivered hydrogen falls accordingly. Liquid hydrogen can then come out ahead on whole-chain losses even for non-PEM equipment, so a site-specific calculation is needed.
Second, when liquid hydrogen demand is tied to a large continuous consumer. Shorter storage periods mean less boil-off, and if boil-off gas is fed straight to a fuel cell or boiler, the loss is effectively recovered. Under that condition most of liquid hydrogen’s drawbacks disappear and only its purity advantage remains.
The single selection rule: if the final consuming equipment can accept ammonia or partially cracked gas, choose the ammonia path; if it only accepts high-purity pure hydrogen, choose liquid hydrogen; then settle the decision on stockpile period and cracking heat source.