Bottom line first. Australia will put up to AUD 49 million into a factory for Hysata’s electrolyzers, which are promoted as about 95% efficient, but that 95% cannot be compared directly with the 65–75% of conventional electrolyzers until its basis is known. Depending on whether it is stated on hydrogen’s higher heating value (HHV) or lower heating value (LHV), the same unit’s efficiency shifts by close to 15 percentage points, and it shifts again depending on whether it is stack-only or system efficiency including the rectifier and balance of plant. Electrolyzers should be compared in “kWh consumed at the point of supply per kg of hydrogen,” not in efficiency percentages, and until that figure is published, 95% should be used only as a shortlisting number.
What was reported
On September 18, SolarQuarter reported that the Australian Renewable Energy Agency (ARENA) will provide AUD 49 million to Hysata through the Future Made in Australia Innovation Fund. Hysata is investing the same amount, for a total project value of AUD 98 million, and the plant will be built at Port Kembla in the Illawarra region of New South Wales. Initial annual production capacity is 50 MW, with potential to expand to 200 MW a year.
According to the article, Hysata’s electrolyzer efficiency is about 95%, against “65% to 75%” for conventional electrolyzers. Cumulative government support is $84 million in grants plus $26 million in equity from the Clean Energy Finance Corporation (CEFC). Around 40 new skilled jobs will be created; Hysata currently employs 120 people and spends $20–30 million a year with Australian suppliers. Target industries mentioned were steel, heavy transport and fertilizer manufacturing.
SteelOrbis, covering the same story on September 22, reported that Hysata’s technology is a capillary-fed electrolyzer derived from University of Wollongong research, and that core components including membranes, anodes and cathodes will be manufactured in Australia. It said expansion to 200 MW a year would come through continuous operations, and ARENA stated that the technology could support decarbonization of hard-to-abate industries such as steelmaking, chemicals, shipping and heavy transport.
Converting efficiency percentages to kWh/kg
Hydrogen’s heating value is about 39.4 kWh/kg on an HHV basis and about 33.3 kWh/kg on an LHV basis. At efficiency η, the electricity needed per kg of hydrogen is “heating value ÷ η.” The article does not state the basis of the 95%, so both cases are calculated.
| Stated efficiency | HHV-basis consumption | LHV-basis consumption |
|---|---|---|
| 95% | approx. 41.5 kWh/kg | approx. 35.1 kWh/kg |
| 75% | approx. 52.5 kWh/kg | approx. 44.4 kWh/kg |
| 65% | approx. 60.6 kWh/kg | approx. 51.2 kWh/kg |
The same “95%” differs by more than 6 kWh/kg in consumption depending on the basis. Conversely, 41.5 kWh/kg on an HHV basis restated on LHV is 33.3 ÷ 41.5 ≈ 80%. So if this unit is 95% on HHV, it is about 80% on LHV, and against another product’s 75% stated on LHV, the gap is smaller than the headline suggests. The article also does not say which basis the 65–75% comparison uses, so side-by-side comparison is on hold until the basis is confirmed.
Where it wins, where it doesn’t
Current conditions
The cost of electrolytic hydrogen is split between electricity and capital. At sites with high power prices and high utilization, electricity dominates and efficiency drives cost. At sites that take only surplus renewables and run a few hours a day, capital has to be spread over little output, so capital cost dominates.
What changes with a high-efficiency electrolyzer
Assumption: 1 MW input at the point of supply, with both the reported 95% and 75% taken on an HHV basis. Hourly output is 1,000 ÷ 41.5 ≈ 24.1 kg versus 1,000 ÷ 52.5 ≈ 19.0 kg, about 27% more from the same electricity. Where electricity dominates cost, that 27% flows almost directly into cost reduction.
The connecting logic
High-efficiency electrolyzers therefore win where power prices are high and annual operating hours are long. They lose where power is nearly free but operating hours are short; there, capital cost per MW, part-load behavior and durability under repeated start-stop come before efficiency. The factory’s production capacity (50 MW a year) separately caps how much can be supplied.
| Site condition | Effect of efficiency | Check first |
|---|---|---|
| Grid power, continuous operation | Large | System kWh/kg |
| Surplus renewables, short runs | Small | Capex per MW, start-up behavior |
| Directly coupled to variable source | Medium | Part-load efficiency, response speed |
| Continuous industrial supply | Large | Degradation rate, maintenance interval |
Efficiency is the deciding variable in only two of these rows. Putting the efficiency figure first in electrolyzer selection is justified only for continuous operation; at sites coupled to variable generation, the part-load kWh/kg curve matters more than rated efficiency.
What to check in manufacturer data
- Efficiency basis: require the heating-value basis, HHV or LHV, for any stated figure.
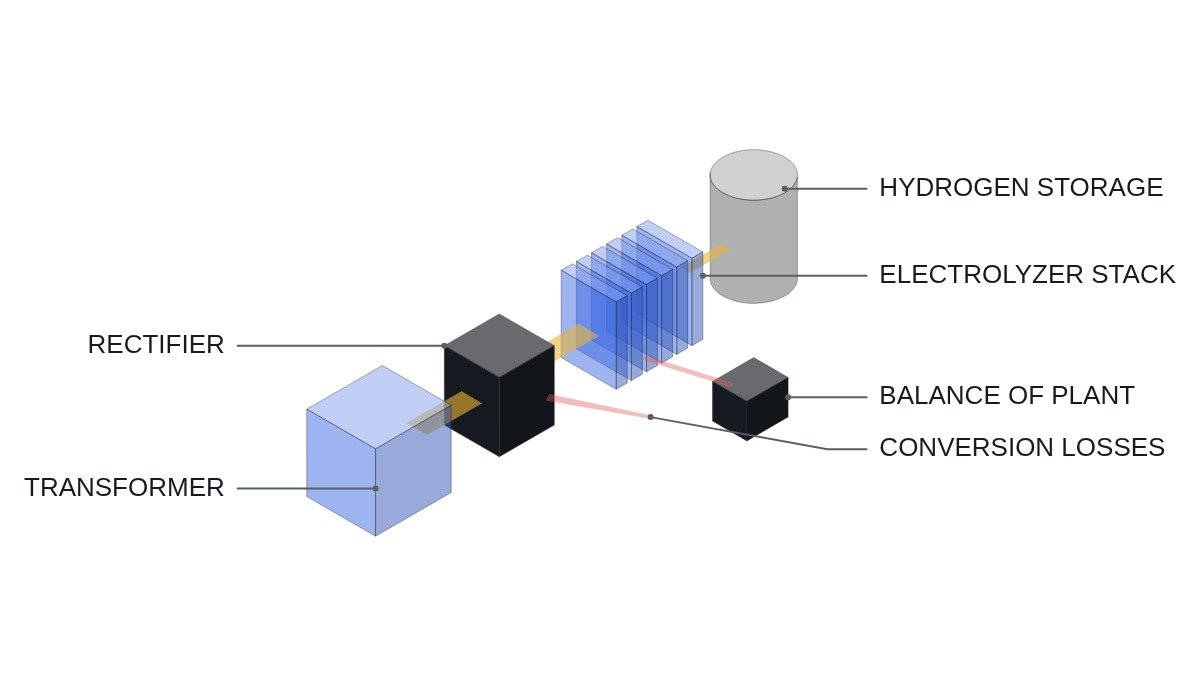
- Boundary: confirm whether it is the stack alone or the system including rectifier, transformer, pumps, dryer and compressor. kWh/kg at the point of supply is the final comparison value.
- Part-load curve: obtain kWh/kg across 20–100% of rating.
- Degradation: confirm efficiency loss over operating hours and stack replacement interval. Initial efficiency alone cannot settle lifetime cost.
- Rectifier power quality: confirm that harmonics and power factor of the large rectifier load meet connection-point requirements. Actual impact requires waveform analysis and field measurement.
- Items to verify: the basis of the reported 95% and the test conditions (current density, temperature, pressure) are not confirmed by the articles.
Boundary conditions
The case for a high-efficiency electrolyzer reverses under the following conditions. First, when 95% is stack efficiency and widening the system boundary narrows the gap through auxiliary losses. Second, at short-run sites using only surplus power, where electricity is a small share of cost and the value of a 27% efficiency gain is buried by the capex difference. Third, when long-term supply contracts are signed before enough degradation data and operating history exist for a new technology; a high initial efficiency with fast degradation can reverse the lifetime-average ranking.
The single decision rule is this: select electrolyzers by lifetime-average kWh/kg at the point of supply, calculated for the site’s expected operating pattern, not by efficiency percentage.
References
- SolarQuarter, “Australia Invests $49 Million To Scale Hysata Hydrogen Electrolyser Manufacturing At Port Kembla”, 2026-09-18, https://solarquarter.com/2026/09/18/australia-invests-49-million-to-scale-hysata-hydrogen-electrolyser-manufacturing-at-port-kembla/
- SteelOrbis, “Hysata secures funding for electrolyzer manufacturing project in Australia”, 2026-09-22, https://www.steelorbis.com/steel-news/latest-news/hysata-secures-funding-for-electrolyzer-manufacturing-project-in-australia-1478970.htm