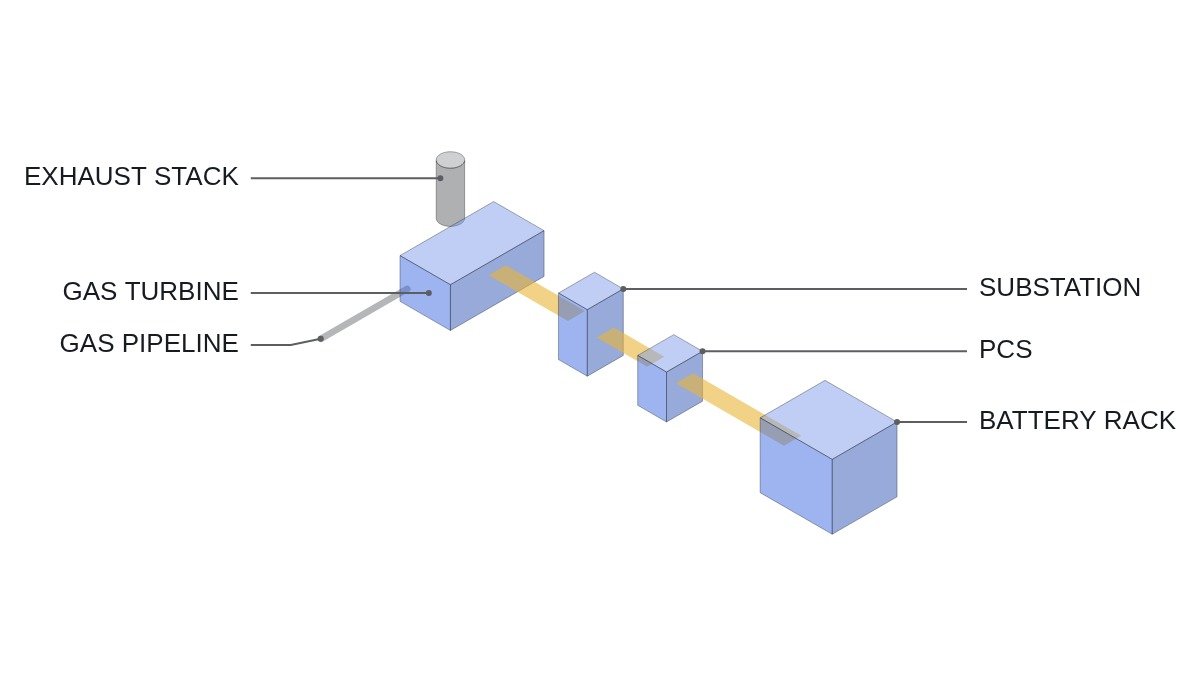
Here is the conclusion up front. In peak response, what separates a gas turbine peaker from a BESS is not equipment price but how long peak events last and how many days in a row they arrive. A BESS responds fast and can earn from frequency response and energy shifting on ordinary days, but once its stored kWh are spent it needs time to recharge. A gas turbine takes minutes to start and burns fuel, yet it holds output for as long as fuel keeps coming. So on grids where short peaks of a few hours repeat daily, the BESS wins; on grids where cold snaps or heat waves stretch peaks over several days with no charging window in between, the gas turbine peaker wins.
Where it wins, where it doesn’t
Where BESS wins
The current conditions: a short evening peak repeats every day, and during daytime solar surplus pushes prices down or triggers curtailment. With a BESS, daytime surplus charges the battery and the evening peak discharges it, so peak response and energy shifting happen in one asset. On days without a peak it can still bid into frequency response or reserve markets, so it never sits idle. The logic is utilization: unlike a peaker that runs a few dozen hours a year, a BESS cycles daily and stacks several revenue streams.
Where the gas turbine peaker wins
If winter cold snaps or summer heat waves stretch peaks across many hours for several consecutive days, the judgment changes. A gas turbine delivers rated output with no time limit as long as fuel supply holds. The logic is the presence or absence of an energy constraint: a BESS is limited in both power (kW) and energy (kWh), while a peaker is limited only in power.
Where the gas turbine peaker loses
Where emission rules are strict, where noise and exhaust permitting near urban areas is hard, or where pipeline capacity competes with winter heating demand, the peaker’s advantage of unlimited duration itself becomes shaky. A cold-snap peak coincides with the peak in gas heating demand, so fuel supply margin must always be checked separately.
A BESS’s peak capability is set by its charging window
To cover a peak every day, a BESS must refill what it discharged before the next peak. Assumptions: 100 MW / 400 MWh BESS, 88% round-trip efficiency, 100 MW charging power, full discharge then full recharge.
Delivering 400 MWh again means charging about 400 ÷ 0.88 ≈ 455 MWh including losses, which takes about 4.5 hours at 100 MW. This asset can repeat a 4-hour peak every day only if the grid offers a continuous charging window of at least 4.5 hours with spare capacity. When load stays high through the day, as in a cold snap, the window disappears, and after the first day’s discharge the battery covers only part of the second day’s peak.
A gas turbine has no refill condition but carries a fuel supply condition instead. Assumption: 35% gas turbine efficiency (simple cycle). Producing 100 MW for one hour takes about 100 ÷ 0.35 ≈ 286 MWh of gas on a heat-content basis. The longer the peak, the more the fuel contract and pipeline capacity become the constraint.
The cost of riding through with BESS when there is no charging window
To ride through a multi-day peak with BESS alone and no charging window, required storage grows in proportion to the number of consecutive days. Under the same assumptions, if a 4-hour peak repeats for three days with no chance to charge in between, power stays at 100 MW but storage must triple from 400 MWh to 1,200 MWh. The power equipment stays the same and only the cells triple, so each additional day of coverage adds a full set of cells. In the same situation, a gas turbine adds no equipment and simply burns more fuel. For this reason, on grids where a multi-day peak is the design-basis event, the practical answer is often to pair the BESS with a small peaker or demand response instead of lengthening its duration. The mix must be sized from each grid’s load records, not from a generic value.
Side-by-side comparison
| Item | Gas turbine peaker | BESS |
|---|---|---|
| Response | Start-up in minutes | Sub-second |
| Duration | Limited by fuel supply | Limited by stored kWh |
| Multi-day peaks | Can cover | Depends on charging window |
| Everyday value | Mostly standby | Frequency response, shifting |
| Emissions, noise | Permitting issue | No on-site emissions |
| Aging drivers | Starts, running hours | Cycle and calendar aging |
| Grid inertia | Synchronous generator | Emulated when grid-forming |
Rows two and three are the essence of peak response. If the duration distribution of peak events fits inside the BESS’s storage time and a charging window exists every day, most of the other rows tilt toward BESS. If a multi-day peak is the design-basis event, however, an asset that cannot survive that one day will struggle to count as a peak resource, no matter how much it earns on ordinary days.
Judgment by peak event type
| Peak type | Key constraint | Favored |
|---|---|---|
| A few hours every evening | Response, repetition | BESS |
| Rare short spikes | Response speed | BESS |
| Multi-day cold snap or heat wave | Sustained energy | Gas turbine peaker |
The takeaway is not to cover every type with one asset. Define the design-basis peak event first, pick the main asset according to which row that event falls in, and fill the remaining types with supporting resources; total cost comes out lower that way.
Decision sequence
- Extract the distribution of peak event duration and consecutive days from historical load data. This distribution comes before the maximum peak MW.
- Define the design-basis event: decide whether it is the multi-day peak or the daily repeating peak.
- For a BESS candidate, check charging window length and grid headroom as in the calculation above, and derive how many consecutive days it can cover.
- For a gas turbine candidate, check winter gas supply margin, pipeline capacity and the likelihood of an emissions permit.
- Put everyday revenue (frequency response, energy shifting) and standby cost of both assets side by side on an annual basis.
Items to verify
- History of multi-day peak events on the target grid and hourly load headroom during those periods
- Start-up time per gas turbine model and how start count feeds into maintenance intervals (manufacturer specification to be confirmed)
- Duration requirements for storage in the peak resource qualification rules
- Interruption terms in the winter gas supply contract
Boundary conditions
The BESS advantage flips the moment the charging window disappears. When days of high daytime load and weak solar output follow one another, as in a prolonged cold snap, the BESS loses most of its value as a peak resource after the first day. Conversely, the gas turbine’s advantage flips the moment its fuel supply competes with the same cause as the peak, or emission rules cap its annual running hours. Both assets reveal their weakness in the same weather event, so the starting point is to define the design-basis event as a weather scenario. Choosing on average-day economics alone misses which of the two actually holds up on the day a peak resource is needed.
The single selection criterion: if a charging window to refill the BESS exists every day between design-basis peak events, make BESS the main peak resource; if not, make it the gas turbine peaker.