Bottom line first. The main variable that eats into PEMFC stack life is not average output but the time cells spend at high potential, the number of times potential swings up and down, and the number of start-stop cycles. For the same energy produced, a stack that runs steadily near rating lasts, while a stack that repeats no-load idling, sharp load following and frequent start-stops ages quickly. Stack life is therefore set not by the stack datasheet but by the operating conditions the system hands to the stack, and the most powerful lever over those conditions is the control settings of the battery and DC-DC converter sitting next to it.
Where it wins, where it doesn’t
Look at the current state first. Stack life is often summarised as a single “rated hours” figure, but that figure belongs to a specific test profile. When the field load differs from the test profile, the same stack can have a very different life. The datasheet an equipment engineer receives rarely makes that difference visible.
Wire the stack straight to the load and make it follow demand, and the effect is immediate. Every time load drops, cell voltage rises toward open-circuit voltage (OCV); every time load rises, it falls again. This potential cycling drives dissolution and redeposition of the cathode platinum catalyst, particles grow, and the active reaction area shrinks. Long near-zero-load idle periods add high-potential dwell time, which also speeds up chemical degradation of the membrane.
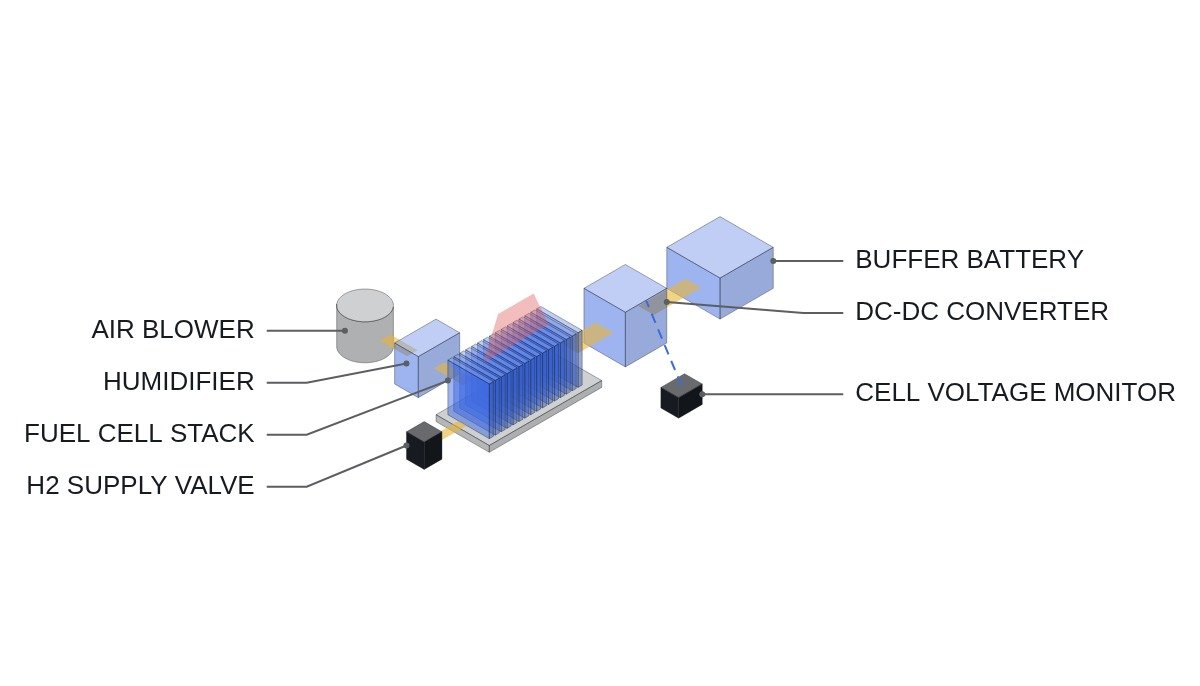
Change the operating conditions with a battery hybrid and the result is different. The stack moves gently within a narrow output band, while load swings and no-load periods are absorbed by the battery. Put a ceiling on cell voltage so it cannot climb toward OCV and high-potential dwell itself shrinks. From the stack’s point of view, the load becomes close to steady-state operation.
The connecting logic: stack degradation is chemistry inside the stack, but the potential, humidity and temperature conditions that trigger it are created by the power converter and the balance of plant (air, hydrogen and cooling loops). Most countermeasures are therefore electrical and control settings.
Degradation modes and their triggers
| Degradation mode | Triggering condition | System countermeasure |
|---|---|---|
| Catalyst dissolution, particle growth | Potential cycling from load swings | Limit stack ramp rate with battery buffer |
| Membrane chemical degradation | OCV or low-load idle, low humidity | Cell voltage ceiling, no no-load idle |
| Cathode carbon support corrosion | H2/air front during start and stop | Purge and dummy-load discharge at shutdown |
| Cell reversal (anode corrosion) | H2 supply lag on load step (fuel starvation) | Lead H2 supply, limit ramp-up |
| Membrane mechanical degradation | Wet-dry cycling, thermal cycling | Damp sudden humidifier and coolant changes |
| Freeze damage | Residual water freezing after sub-zero stop | Dry purge at shutdown, cold-start procedure |
Read this table from the right-hand column. Not one of the six countermeasures changes stack materials; all of them are operating settings such as ramp rate, voltage ceiling, purge sequence and humidity control. When a stack life problem lands on your desk, the operating log comes before the replacement spec.
Comparison by operating strategy
| Strategy | Potential cycling | High-potential dwell | Start-stop | Life |
|---|---|---|---|---|
| Constant-output base load | Low | Low | Rare | Favourable |
| Direct load following | High | High when idle | Frequent with load | Unfavourable |
| Battery hybrid + voltage ceiling | Low | Low | Absorbed by battery | Favourable |
| Frequent start-stop (fuel saving first) | Medium | Momentary at start | Very frequent | Unfavourable |
The takeaway from the second table is that “shutting down often to save fuel” can be a loss in terms of life. The damage one shutdown does to the cathode may exceed the damage from running a little longer at low output, so in equipment with short, repeated idle periods it is often better to hold minimum output and push the surplus into the battery than to shut down. Which is larger differs by stack, so it requires manufacturer data and field measurement.
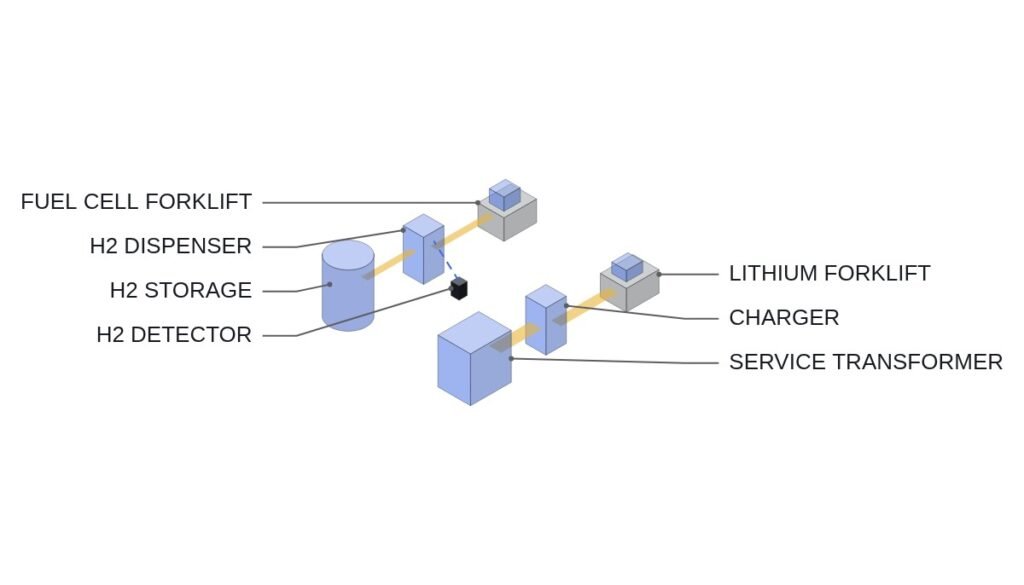
The combination of unfavourable conditions also changes with the application. Mobility, such as vehicles and forklifts, sees many load swings and start-stops at once; emergency backup sits idle for long periods and starts rarely; small stationary generation is close to steady-state. With the same stack, ramp-rate limits and the voltage ceiling decide life in mobility, while membrane humidity during long storage and the start-up procedure decide it in backup service.
Turning this into settings
The distinctive point of this article is that hybrid battery capacity should be sized as a “stack life management” item, not only as a “power assist” item. With a small battery, SOC quickly reaches its upper limit, and from then on the stack has nowhere to send surplus power, so it must throttle down, rise toward OCV or shut down. All three are unfavourable conditions from the table above. Battery capacity should therefore be checked not only for peak power but also for “the energy needed to absorb the stack’s minimum output during the lowest-load period”.
With assumed values: stack minimum sustain output 5 kW, load during the lowest-load period 1 kW, lasting 30 minutes. The battery must absorb (5 − 1) × 0.5 = 2 kWh. Without room for those 2 kWh inside the SOC window, the stack either stops or climbs to high potential. Size the battery on peak power alone and this condition is easy to miss.
- Confirm in writing the cell voltage ceiling setpoint and what happens when it is reached (hold output, charge the battery, or stop).
- Check the stack ramp-up and ramp-down limits and whether hydrogen and air supply are commanded ahead of load.
- Check that the shutdown sequence includes purge and residual voltage discharge steps, and which steps are skipped on an emergency stop. An emergency stop must trip immediately through the hardwired safety circuit; record its degradation impact as an accepted item.
- Extract start-stop count, time near OCV and the trend of cell voltage spread from the operating log each month.
- Track the location of cells with growing voltage spread to separate distribution problems (local fuel starvation, flooding) from whole-stack degradation.
Items to verify: the high-potential threshold, performance loss per start-stop and allowable ramp rate depend on stack design and are not given as general values here. Confirm them from the manufacturer’s operating instructions and measured data.
Boundary conditions
“Steady operation plus battery absorption” is not always right. First, where the battery is already large and expensive, the added battery cost can exceed the value of longer stack life. Compare stack replacement cost with battery expansion cost over the same period. Second, equipment with long idle periods. If there is almost no load for several hours, holding minimum output only wastes hydrogen, and a normal purged shutdown is better. Third, cold environments. Stopping below freezing requires freeze countermeasures, which can favour fewer stops; weigh the fuel lost to idle running against the cost of freeze protection.
A single selection criterion to close. If the hydrogen spent holding minimum output plus the high-potential dwell accepted over the expected idle time costs less than the cathode damage of one shutdown, keep running; if it costs more, do a purged shutdown. Set that crossover time only from measurements on the actual stack.