Bottom line first. The finding reported from a Korea Power Exchange study, “a 55% increase in solar requires 220% more ESS,” is not a typo but a nonlinear relationship built into the grid. The amount of solar the grid can absorb at midday is roughly fixed at demand minus inflexible generation, and every addition to solar lands on the surplus above that limit. So as solar grows, storage has to grow faster, and the planning metric should not be solar GW but “midday surplus GW and how long it lasts.” The report gives ESS only in power (GW), not in storage duration (MWh), so that part is left as an item to verify.
What was reported
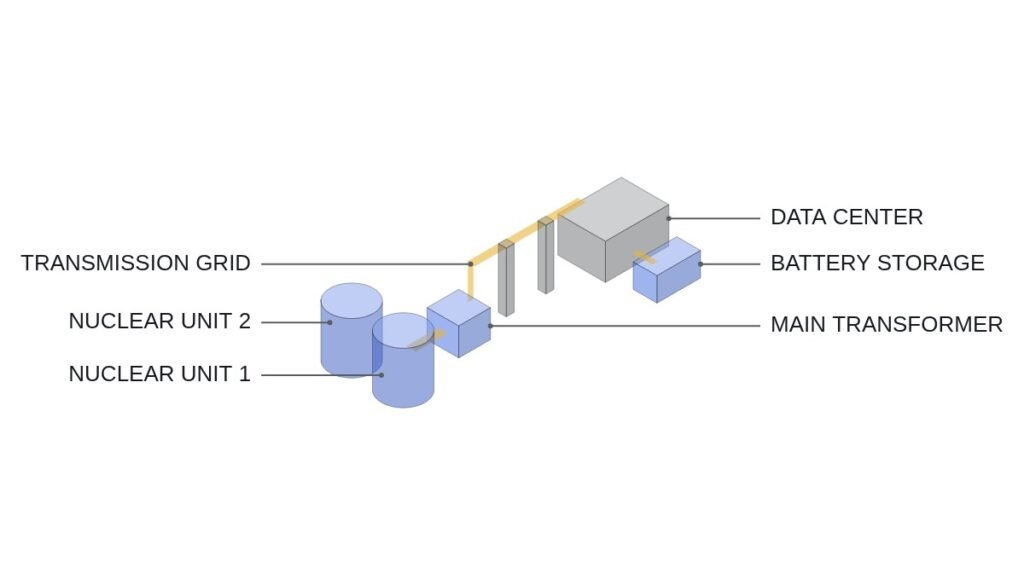
On August 26, Seoul Economic Daily cited the Korea Power Exchange’s baseline grid study for the 11th Basic Plan for Electricity Supply and Demand, reporting that if solar capacity rises 55%, ESS capacity must rise by a further 220% to keep the grid stable. The study puts the optimal ESS capacity for 2030 at 6.08 GW (the scale of four nuclear units); applying the Lee Jae-myung government’s renewable energy master plan raises the requirement to 19.5 GW.
The article explained that without enough ESS, surplus summer-midday solar cannot be absorbed, the supply-demand balance breaks down, and in severe cases the risk escalates to a large-scale blackout. On the global side, it cited SNE Research: ESS battery shipments in the first half of this year were 461.3 GWh, up 71% year on year. Lee Bo-ram, a research fellow at the Korea Institute for International Economic Policy, noted that the battery industry is expanding beyond vehicles and ESS into AI data centers and humanoids.
The ratio of the two reported figures is 19.5 ÷ 6.08 ≈ 3.21, an increase of about 221%, consistent with the 220% in the headline.
Where it wins, where it doesn’t
Current conditions
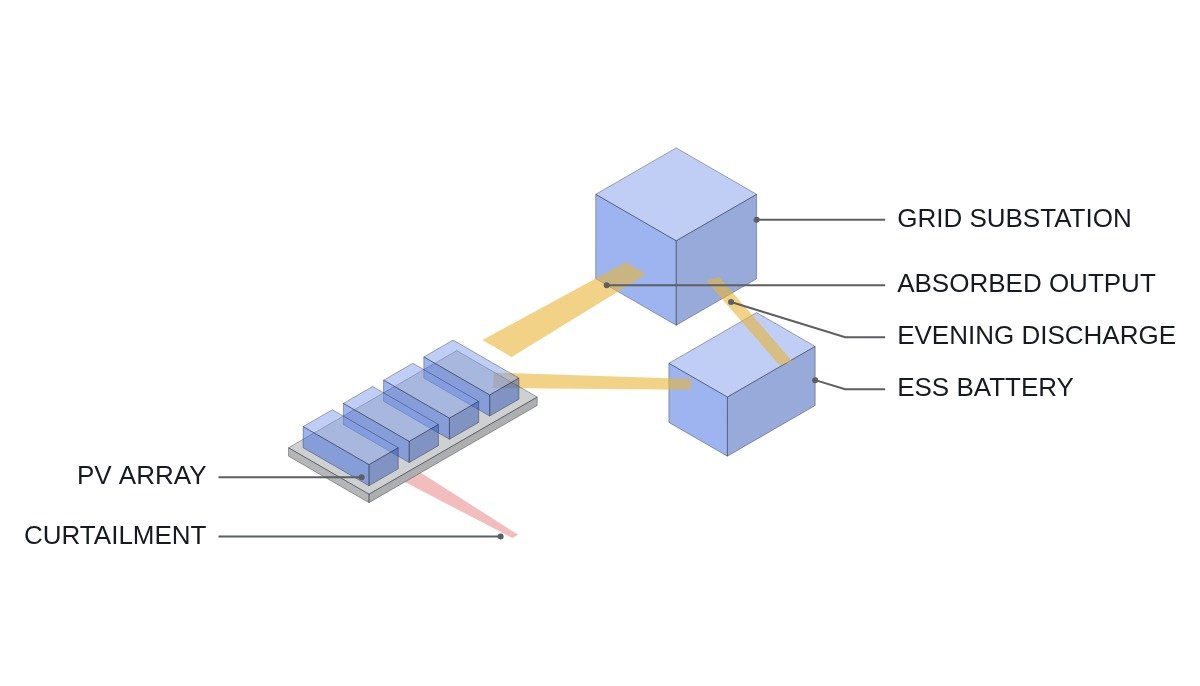
On today’s grid, midday solar surplus is handled mainly by curtailment. Nuclear, coal and other plants with narrow turndown must hold minimum output, and in the spring and autumn light-load seasons these inflexible units alone cover a large share of demand. Solar can only fill the space that is left.
After a 55% increase in solar
Midday demand and the minimum output of inflexible units barely change when solar grows. With the ceiling on absorbable solar unchanged, most of the added capacity falls into surplus. Keeping that surplus instead of discarding it requires storage, and the surplus grows much faster than solar.
The connecting logic
Illustrating the structure with assumed values. Assumptions: midday demand 60 GW, inflexible minimum output 25 GW, coincident solar output 40 GW. These are for illustration only and are not actual grid figures.
- Absorbable solar: 60 − 25 = 35 GW
- Current surplus: 40 − 35 = 5 GW
- Solar output after a 55% increase: 40 × 1.55 = 62 GW
- Surplus after the increase: 62 − 35 = 27 GW (5.4 times the 5 GW)
When solar becomes 1.55 times larger, the surplus becomes 5.4 times larger. The study’s factor of 3.21 appears to reflect demand growth, permitted curtailment, demand shifting and so on, but the nonlinearity comes from the same structure.
| Item | 11th Basic Plan basis | Renewable master plan basis |
|---|---|---|
| ESS needed in 2030 | 6.08 GW | 19.5 GW |
| Ratio | 1.00 | approx. 3.21 |
| Solar premise | Baseline | +55% |
| Storage duration (MWh) | Not reported | Not reported |
The last row is the most important blank for equipment planning. Whether 19.5 GW is built as 2-hour or 4-hour systems doubles the battery volume and changes the role the grid expects. If the goal is midday surplus absorption, the surplus duration sets the storage duration; if evening peak support is added, discharge duration has to be longer. That is why project volumes must not be sized from GW alone.
For a sense of scale, a calculation with assumed durations. Building 19.5 GW as 2-hour systems gives 39 GWh; as 4-hour systems, 78 GWh. Against the reported 461.3 GWh of global ESS battery shipments in the first half of this year, that is about 8% and about 17% respectively. One country’s 2030 target equals a high single-digit to mid-teens percentage of half a year of global shipments, which means cell procurement and interconnection sequencing have to be scheduled backward from the target year. On the 6.08 GW basis, the same 4-hour assumption gives 24.3 GWh, a procurement volume one step smaller.
Comparing ways to handle surplus
| Measure | Favorable when | Unfavorable when |
|---|---|---|
| Battery ESS | Surplus of a few hours, every day | Extreme surplus only a few days a year |
| Curtailment | Rare surplus, no extra equipment | Becomes routine, erodes generator revenue |
| Demand shifting | Movable industrial and charging loads | Limited movable load |
| Pumped hydro | Long duration, large scale | Siting limits, long build time |
| Turning down inflexible units | Where turndown margin exists | Minimum-output limits such as nuclear |
The way to read this table is “how often does the surplus come?” Daily surplus is cheaper to handle with ESS; rare surplus is cheaper to curtail. If 19.5 GW is an optimum, it may include a last few GW with low annual utilization. That tranche should be compared against curtailment.
Decision sequence
- Build the surplus duration curve: sort hourly surplus GW for the year by size and see how many GW are left over for how many hours.
- Set storage duration: use the average surplus duration to set the ESS discharge duration. Power (GW) comes after.
- Calculate utilization of the last GW: check how much additional annual absorption (GWh) each extra 1 GW of ESS delivers.
- Compare with curtailment cost: once utilization falls, compare curtailment compensation directly with ESS capital cost.
- Reflect grid location: if surplus concentrates in a different region from where the ESS sits, transmission constraints block absorption. Break it down by region.
- Define operating conditions: grid-absorption ESS receives charge commands at midday and discharge commands at the evening peak. Stating SOC upper and lower limits and the conditions for reporting a refused command upstream in the operating rules is what turns planned capacity into actual absorption.
Boundary conditions
The conclusion that ESS must grow faster than solar weakens under the following conditions. First, when midday demand rises significantly: data center and electrification loads during the day raise the absorption ceiling itself and shrink the surplus. Second, when the minimum output of inflexible units falls: a wider turndown margin reduces surplus for the same solar. Third, when surplus concentrates in specific regions: transmission reinforcement or local ESS in those regions then takes priority over a national ESS total.
The single decision rule is this: keep adding ESS only as long as the value of the surplus energy each additional 1 GW absorbs per year exceeds the cost of curtailing the same amount.
References
- Seoul Economic Daily (서울경제), “태양광 55% 늘면 ESS 220%…배터리에 달린 전력안보” (If solar grows 55%, ESS must grow 220%: power security rests on batteries), 2026-08-26, https://www.sedaily.com/article/20083669