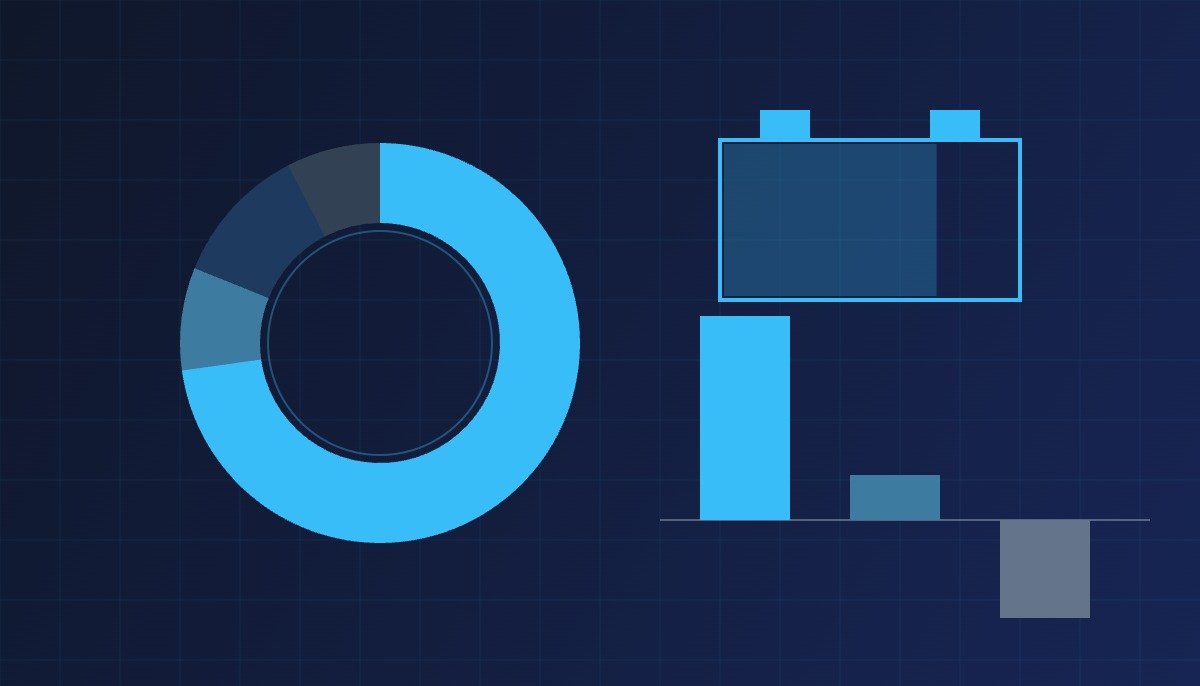
The EV battery market as a whole grew 20%, but Chinese companies took most of that growth. Korea’s three battery makers instead saw their share fall or dropped out of the rankings. The causes are domestic volume and the cost competitiveness of LFP (lithium iron phosphate).
Current condition
The combined share of seven Chinese companies (including CATL and BYD) reached 72.8%, up 3.1 percentage points from the same period a year earlier. The market as a whole grew 20.4%.
After the change
| Company | Volume | YoY | Rank | Share change |
|---|---|---|---|---|
| LG Energy Solution | 60.3GWh | +4.5% | 3rd globally | 9.6% → 8.3% (−1.3%p) |
| SK On | 22.3GWh | −9.8% (contraction) | 8th | – |
| Samsung SDI | – | – | Outside top 10 | – |
What this table says — LG Energy Solution’s volume itself grew (+4.5%), but it fell short of the market’s average growth rate (20.4%), so its share actually shrank. SK On’s volume itself fell, and Samsung SDI dropped out of the top-10 tally altogether.
Connecting logic
The Chinese advantage comes from two things. The first is enormous domestic volume; the second is the cost competitiveness of LFP batteries. Because LFP uses no nickel or cobalt, it is relatively less sensitive to swings in raw material costs, and this cost advantage is carrying beyond the domestic market into price competitiveness in overseas orders as well.
Where a share figure turns into a production plan
A 1.3-percentage-point drop in share is one line in a news report, but on the production side it is a number that changes the premise of the utilization plan. Volume growing only 4.5% while the market grew 20.4% means that lines already built are running below their planned utilization. Cell lines carry a large share of fixed cost, and when utilization falls, cost per cell rises immediately, so a drop in share is reflected once more in the next year’s cost competitiveness.
Two decisions split here. Stop lines to cut fixed cost, or redirect volume to other demand to fill utilization? The former brings restart costs and the problem of retaining staff; the latter brings the problem of changing line specifications.
EV lines and ESS lines: what differs
| Item | EV cell line | ESS cell line | Issue when converting |
|---|---|---|---|
| Priority requirement | Energy density, fast charging | Cycle life, unit cost | The criteria for choosing chemistry differ at the root |
| Cell format | Dimensions fixed per vehicle model | Format matched to rack assembly | Extent of dimensional change to winding and stacking equipment |
| Quality standard | Tied to vehicle safety standards | Tied to fire safety and grid-connection standards | Resetting inspection processes and pass criteria |
| Demand fluctuation | Bound to automakers’ production plans | Ordered project by project | Difficulty of forecasting the operating schedule |
What this table says — filling an EV line with ESS volume is not a matter of running a different product through the same line; it means moving chemistry, format and inspection criteria together. The easy range for conversion is low-cost ESS with lower cycle life requirements, and the hard range is lines dedicated to a vehicle model with fixed cell dimensions.
The table above compares the nature of equipment requirements; quantitative values such as conversion retrofit cost and time are not in the source material and are left as items to verify.
How to read the LFP cost advantage
That LFP uses no nickel or cobalt means it is less shaken by raw material price swings, not that its total cost is lower under all conditions. LFP takes more volume and weight to hold the same capacity, so in applications where energy density is the judging criterion, cost comes back at the pack and vehicle stage even if the cell price is low. Conversely, in stationary storage applications where volume constraints are loose and cycle life is the judging criterion, this weakness does not show up as cost.
In other words, the cost advantage comes not from a property of the chemistry itself but from what the application uses as its judging criterion. The fact that the Chinese advantage is observed in both EVs and ESS at the same time is more reasonably read as domestic volume creating economies of scale in both applications.
What to check alongside these numbers
- Look at change relative to market growth, not the change in volume — share can fall even while volume rises.
- The scope of the share tally — whether it covers EV only or total shipments including ESS changes the same company’s ranking.
- Regional breakdown — share in the market excluding China’s domestic market is not separated out in this data.
- Utilization — an indicator that reaches cost before share does, and one that cannot be confirmed from external data.
Of the four items, the one that goes directly into a production plan is the last. Share is an outcome indicator; whether to stop lines or redirect volume is decided first by utilization. When utilization cannot be known from public data, one approach is to use the gap between an expansion announcement and the actual start of mass production as a proxy indicator, but this too is an estimate and is not stated as fact.
Boundary conditions
This advantage will not last indefinitely. In the same period, a brake is being applied to battery expansion within China itself. With concerns about oversupply growing — newly planned battery production capacity this year amounts to 1.5 times China’s total production last year — moves to curb expansion are appearing at the government level. If oversupply actually leads to restructuring, whether the current share advantage holds is a separate question.
For Korea’s three makers, the shift in demand toward North American ESS (such as Tesla’s Megapack expansion) should be considered together as a variable that could offset the loss of share in the EV market — though there is no quantitative data in this material to gauge the size of that offset.