Bottom line first. The upper limit on fast-charge C-rate is not a fixed number per cell; it is a function of cell temperature and SOC window. The main degradation path in fast charging is lithium depositing as metal on the anode surface (lithium plating), and that risk peaks where low temperature, high SOC and high current coincide. So the useful question is not “how many C can this cell take” but “how many C at which temperature and SOC”, which is what a charge map answers. Fast charging pays off in operations where cells can be preheated before charging and the charge window can be kept in the low-to-mid SOC range.
Where it wins, where it doesn’t
Current condition
When planning charging infrastructure, charge time is usually worked out first from the charger rating (kW) and pack energy (kWh). If the pack can accept less current than the charger rating, the charger sits partly idle; if more, the charger becomes the bottleneck. What this calculation leaves out is that the current a cell can accept changes sharply with temperature and SOC.
After the change
Seen through a charge map, fast charging is not a single C-rate but a set of current setpoints by window. The cell takes high current at low SOC, and current is stepped down as SOC rises (multi-stage constant current). At low cell temperature, the allowed current at the same SOC must be lower still. The result is that “charge time” is decided not by the charger rating but by the cell temperature and SOC at arrival.
Connecting logic
Lithium plating occurs when the anode potential drops below the lithium reference potential. At high current, lithium diffusion inside the anode cannot keep up, so the surface potential falls; at low temperature, diffusion and reaction slow down, so the potential falls faster at the same current. At high SOC, the anode is already largely filled with lithium and has less margin. Because all three push in the same direction, charge maps are drawn with temperature and SOC as axes.
Time and heat, calculated
In ideal constant-current charging, charge time is ΔSOC / C-rate. Heat is approximated as Joule heating, I²R. Assumptions: cell capacity 100Ah, cell DC internal resistance 1mΩ (held constant regardless of temperature and SOC for simplicity), charge window 10 to 80% (ΔSOC 70%), constant current throughout, taper ignored.
| C-rate | Current | Charge time | Cell heat | Heat per charge |
|---|---|---|---|---|
| 0.5C | 50A | 84 min | 2.5W | 3.5Wh |
| 1C | 100A | 42 min | 10W | 7Wh |
| 2C | 200A | 21 min | 40W | 14Wh |
| 3C | 300A | 14 min | 90W | 21Wh |
Two relationships matter in this table. Charge time falls in inverse proportion to C-rate, but cell heat (W) rises with the square of C-rate, and heat generated per charge (Wh) rises in proportion to C-rate. In I²R x t, t = Q / I, so the heat becomes I x R x Q. Double the C-rate and the time halves, but the heat the cooling system must remove at any moment quadruples. That is why the fast-charge limit often shows up in the thermal system before it shows up in the cell.
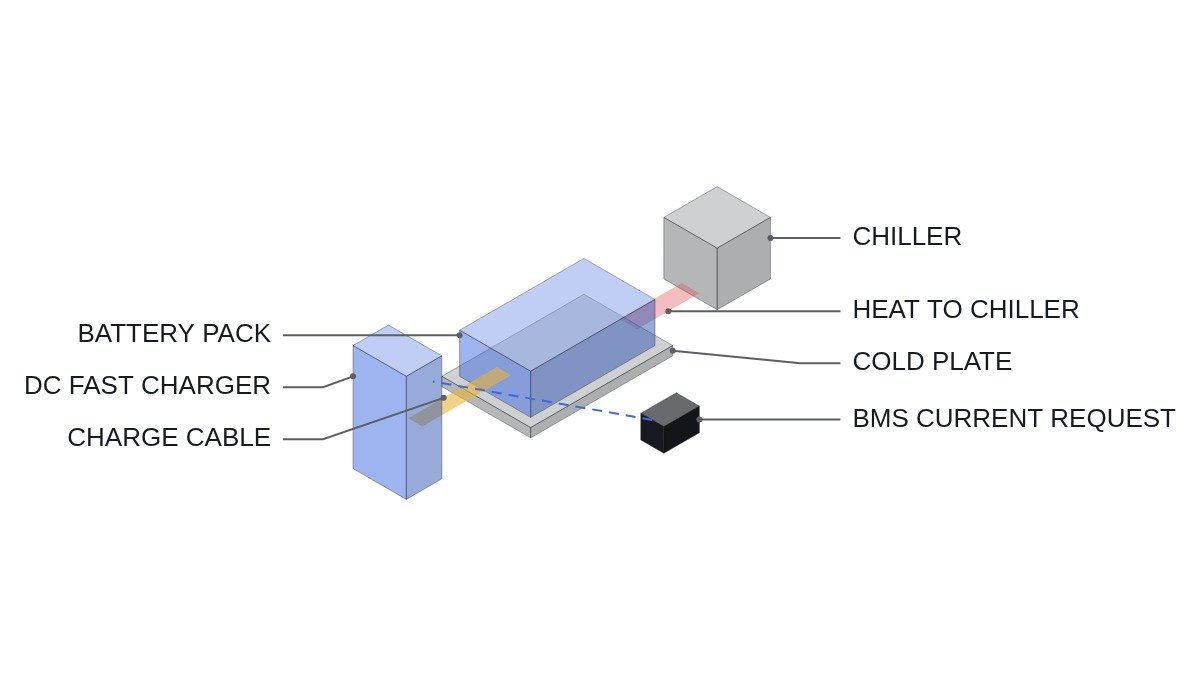
Moving the cell C-rate up to pack and charger level reveals one more relationship. Assumption: pack energy 80kWh. A 2C charge is about 160kW at pack level; with a 400V-class pack the charge current is about 400A, with an 800V-class pack about 200A. The C-rate the cells see is the same in both cases, but the current through the charge cable, connector and pack busbars halves at 800V, and Joule heating in that path drops to a quarter. Raising pack voltage does not reduce cell degradation, but it pushes back the thermal limit of the charging path. Separating the cell limit from the path limit is how you find the real fast-charge bottleneck.
Judgment by condition
| Cell condition | Low SOC | Mid SOC | High SOC |
|---|---|---|---|
| Cold | Preheat, then limited charge | Hold low current | Avoid fast charging |
| Room temperature | High current allowed | Step down | Low current, switch to CV |
| Hot | Allowed within cooling capacity | Allowed within cooling capacity | Limit current (heat build-up) |
Of the nine cells in this table, the one that allows high current is essentially room temperature at low SOC; every other cell comes with a restriction. The practical levers for better fast-charge performance lie first in preheating before arrival and in managing the charge window, not in changing cells. Actual current values for each cell of the table must follow the cell maker’s charge map and are not given here as general values.
Decision sequence
- Obtain the cell maker’s allowed charge current map by temperature and SOC. Without it, do not fix a fast-charge specification.
- Check cell temperature distribution at charge start from operating data. If winter arrival temperatures fall in the cold row of the map, design the preheating system first.
- Use the method above to compute cell heat (W) at the target C-rate and confirm total pack heat is within cooling capacity.
- Decide whether charge speed in the high-SOC window (above 80%, for example) can be given up operationally. If it can, cell stress drops substantially.
- Align charging equipment with the charging system standard (IEC 61851 series) and the current request limit of the vehicle BMS. Where charger output exceeds what the cells allow, the BMS request takes precedence.
The step where this sequence usually stalls first is step 2. The cold row of the charge map cuts fast-charge performance hard, so many winter charge-time complaints trace back not to the cells but to a missing preheating system. Preheating energy is a cost traded against charge time, and you should also check whether it can be absorbed operationally, for example by preheating while driving to the charger.
Boundary conditions
This judgment changes under the following conditions. First, high-power cells with thin electrodes accept higher current at the same temperature and SOC, which shifts the whole map upward. With a different cell design, the boundaries of the table must be redrawn. Second, LFP cells, with their flat voltage curve, make SOC hard to estimate from voltage, so high-SOC detection can lag, leaving room for excessive current in the high-SOC window. SOC estimation accuracy is a prerequisite for applying a charge map.
Third, if the operation requires a full charge once a day, low-current charging in the high-SOC window cannot be avoided, and the real benefit of fast charging remains only in the low-SOC window. Fourth, internal resistance varies with temperature, SOC and ageing, so the heat calculation above is an approximation that shows the trend; actual cell temperature rise must be confirmed by measurement.
Fifth, degradation is a matter of accumulation, not of one fast charge. In an operation where fast charging is rare and most charging is slow, occasional high C-rate may have a limited effect on life. In contrast, in commercial vehicles where nearly every charge is fast, the cumulative effect of the same C-rate grows. Confirm the fast-charge share from operating data, and judge the size of the life impact from the cell maker’s cycle test results by condition, not from general numbers.
The single selection rule: if cells can be preheated to room-temperature range at charge start and the charge window can be cut off at mid SOC or below, a high C-rate wins; if either is impossible, staying on low current within the charge map is better for cell life than raising the C-rate.