Bottom line first. Splitting capacity between the stack and the battery in a fuel cell hybrid does not end with the rule “stack for average, battery for peak”. What actually decides the split is how long the load stays above average in its profile, and whether battery size is bound by energy (kWh) or by power (C-rate). If peaks are short and sharp, a small stack near average load with a high-power battery is the better choice. If above-average periods last several minutes or more, enlarging the stack often beats enlarging the battery.
Where it wins, where it doesn’t
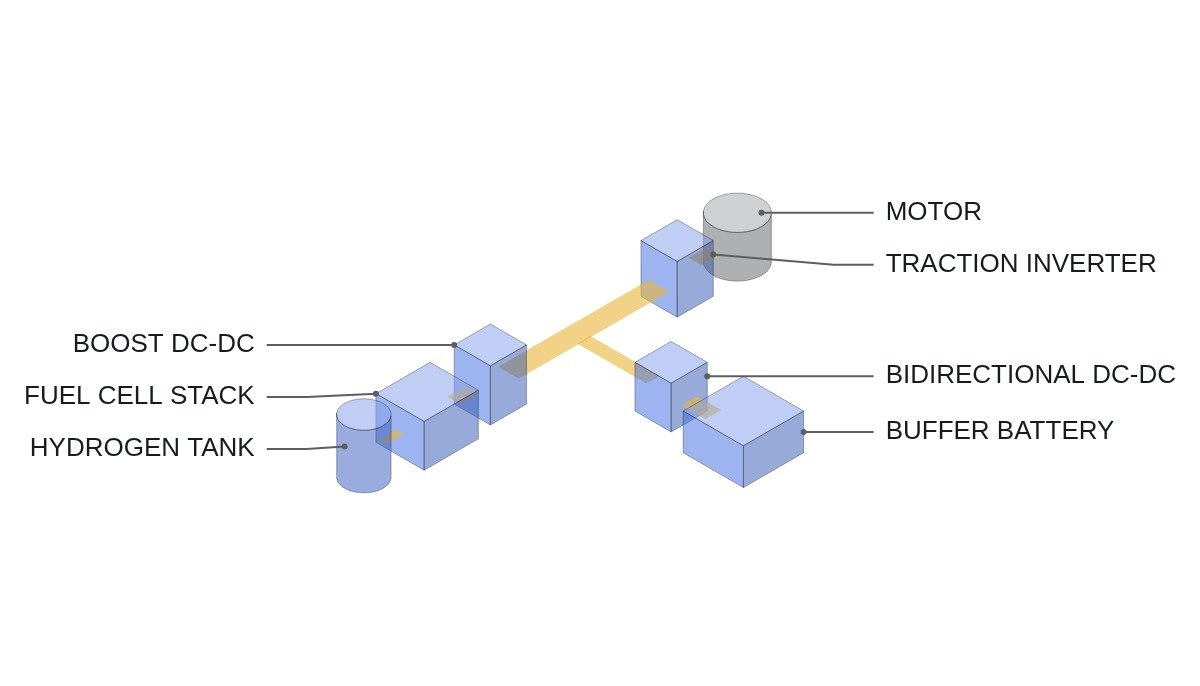
Start with the current state. A fuel cell system cannot carry the load with the stack alone. Because the air blower and the humidification and cooling loops respond with a delay, it cannot follow load steps instantly, and it has nowhere to put regenerated power. Every practical system is therefore stack + DC-DC converter + battery, and the key early design question is “how many kW of stack, how many kWh of battery”.
Make the stack large and the battery shrinks to handling transients and regeneration. This is the fuel-cell-dominant layout. The stack supplies most of the load directly, so hydrogen consumption follows the load, and no external charging infrastructure is needed. In exchange, stack cost and BOP size grow, and the stack takes on more load swings, which worsens its degradation conditions.
Make the stack small and the battery grows to cover all of the above-average demand. Taken to the extreme, this becomes a range-extender layout: a battery vehicle with a stack bolted on to extend range. The stack runs close to steady state, which is good for life, but battery capacity and weight grow, and the economics only work with external charging alongside.
The connecting logic: the split is not a trade between stack cost and battery cost, but a question of which device absorbs the shape of the load profile more cheaply. Short peaks are cheap for the battery to absorb; long above-average stretches are cheap for the stack.
Four conditions that bind battery size
Battery capacity is set by the largest of the following four conditions. Leave any one out and the shortfall will show up in the field.
- Peak power condition: (peak load − available stack output) ÷ allowable discharge C-rate.
- Excursion energy condition: total energy above average during excursions ÷ SOC window.
- Regeneration condition: regenerated power ÷ allowable charge C-rate, and regenerated energy ÷ headroom at the top of the SOC window.
- Stack minimum output condition: (stack minimum sustain output − load) × duration of the low-load period ÷ headroom at the top of the SOC window.
Run the numbers with assumed values. Assumptions: average load 20 kW, a 60 kW peak lasting 60 seconds, a 40 kW hill-climb lasting 10 minutes. Allowable battery discharge 3C, SOC window 50%. The stack ramps gradually rather than instantly, so during peaks it is taken to deliver only its rating.
| Layout | Stack rating | Power condition | Energy condition | Battery result |
|---|---|---|---|---|
| A. Sized to average | 20 kW | 40 kW ÷ 3C ≈ 13.3 kWh | 20 kW × 10 min = 3.3 kWh ÷ 0.5 = 6.7 kWh | 13.3 kWh (power-bound) |
| B. Sized to hill-climb | 40 kW | 20 kW ÷ 3C ≈ 6.7 kWh | 20 kW × 60 s ≈ 0.33 kWh ÷ 0.5 ≈ 0.7 kWh | 6.7 kWh (power-bound) |
| C. Average + high-power cells (10C) | 20 kW | 40 kW ÷ 10C = 4 kWh | 6.7 kWh | 6.7 kWh (energy-bound) |
The takeaway is that, for the same load, the condition that binds the battery changes with the cell type. With energy cells (3C), the power condition sets battery size in both A and B, so B, which adds 20 kW of stack and halves the battery, becomes the alternative. With high-power cells (10C), as in C, the energy condition binds, and the battery can be held at 6.7 kWh without enlarging the stack. The C-rate limit of the cell has to be fixed before the stack rating can be fixed: that ordering is the core result of this calculation.
One condition is missing from the table: SOC recovery. If the stack rating is set exactly at the 20 kW average load, as in layout A, there is no spare output to put back the 3.3 kWh the battery gave up on the hill. Recovery happens only when load falls below average, and if those periods are too short, SOC drifts down over the day. Assumption: raise the stack rating to 24 kW for a 4 kW margin over average, and recovering 3.3 kWh takes 3.3 ÷ 4 ≈ 50 minutes. If the next hill comes within 50 minutes, the stack margin must grow further. Size the stack not on average load but on “average plus enough margin to restore SOC within the gap between excursions”.
Comparison by layout
| Layout | Favourable load | Unfavourable load | External charging |
|---|---|---|---|
| Fuel-cell-dominant | Long above-average stretches | Frequent short peaks | Not needed |
| Balanced | Mix of peaks and excursions | Extremely skewed load | Optional |
| Range extender | Regular stops where charging is possible | Long continuous high load | Required |
Read this table from the unfavourable-load column. For every layout, the unfavourable load is the shape that layout finds expensive to absorb. Measure the load profile first and extract the distribution of peak durations, and the choice of layout almost makes itself.
DC-DC converter and control settings
The capacity split is not finished in hardware; it is completed by the power-split control. The stack power command normally does not follow load power directly but is built from a low-pass-filtered average load plus an SOC error correction. A short filter time constant pushes swings onto the stack; a long one makes the battery swing harder. The filter time constant is, in effect, a second capacity-split variable between stack and battery.
On the protection side, the basics are an interlock that limits load output at the battery SOC lower limit, an interlock that reduces the DC-DC current command when stack cell voltage sags, and a circuit that hardwire-trips the stack and hydrogen supply on hydrogen leak detection. The last one must be a hardware trip that does not pass through controller logic; the controller only monitors and logs its state.
Items to verify: allowable C-rate per cell, stack ramp rate and SOC window vary with manufacturer specifications and temperature. The figures here are assumptions to show the sizing procedure.
Boundary conditions
The split “short peaks to the battery, long excursions to the stack” wavers under these conditions. First, cold operation. When the battery’s allowable C-rate drops, the power condition becomes binding again, and a split sized at room temperature falls short in winter. Second, end of battery life. Capacity and power fall together, so a design based on beginning-of-life capacity misses its conditions at end of life. Third, applications with large regenerated energy. Long descents or braking make the regeneration condition the largest value and the battery grows; enlarging the stack then does not shrink the battery.
A single selection criterion to close. Recalculate the four conditions with the allowable C-rate at end of life and at the lowest operating temperature; if the power condition binds, raise the stack rating to shrink the battery, and if the energy or regeneration condition binds, keep the stack at average load and absorb the rest in the battery.