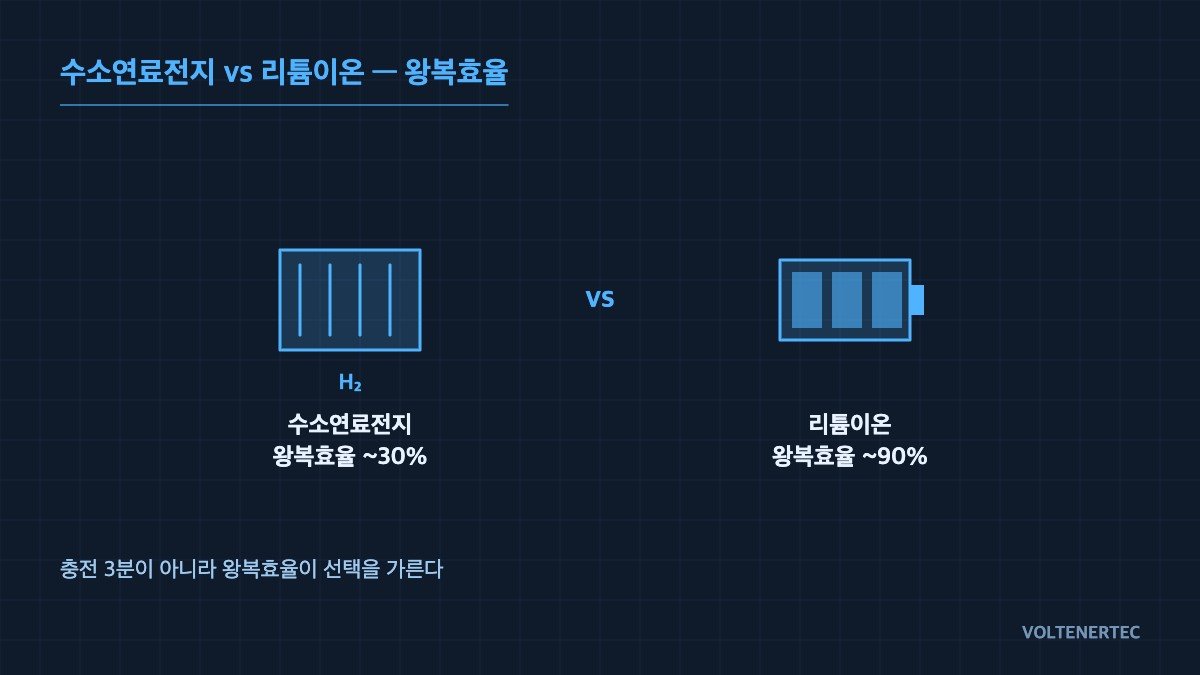
The bottom line first. The real criterion for choosing between a hydrogen fuel cell and a lithium-ion battery isn’t the 3-minute refuel time — it’s the roughly 30% round-trip efficiency. Refuel time is a matter of user experience, but round-trip efficiency determines how much electrical energy you actually have to feed into the system. For the same 1 kWh pulled from the grid, the amount that reaches the load differs — 300 Wh versus 870 Wh — and that gap shows up directly in your operating-cost line.
Efficiency alone doesn’t settle it, though. There is a clear zone where efficiency is not the dominant variable, and the boundary lies in continuous discharge duration. The conditions are set out below.
1. Comparison table — efficiency comes first
| Item | Hydrogen Fuel Cell (PEMFC) | Lithium-Ion Battery |
|---|---|---|
| Round-trip efficiency (power→power) | ~30–35% Electrolysis 60–70% × compression/storage 85–90% × stack 50–60% |
~85–90% System basis, including PCS conversion loss |
| Gravimetric energy density (system) | ~1.5–2.0 kWh/kg Rough figure incl. 700 bar tank, stack, BOP |
~0.15–0.25 kWh/kg Pack basis |
| Volumetric energy density (storage) | ~0.7–0.9 kWh/L | ~0.25–0.45 kWh/L |
| Charge / refuel time | 3–5 min (700 bar passenger-vehicle basis) | ~18 min for SOC 10→80% at 800V·350kW fast charging Several hours at 7kW slow charging |
| Long-term storage loss | Effectively none for compressed-gas storage Liquid storage incurs boil-off |
Self-discharge ~2–3% per month |
| Load-step response | Not capable — hundreds of ms to seconds, limited by air blower/humidification/thermal-management lag | Capable — ms-scale response |
| Output voltage characteristic | Cell no-load ~1.0V → rated 0.6–0.7V, wide swing. DC-DC boost required | Relatively flat across SOC range. Direct-connect configuration possible |
Takeaway: the rows where hydrogen leads are all about storage; the rows where the battery leads are all about conversion and response. These two aren’t competing head-to-head for the same role — they split the roles of storage and output. Because the numbers vary widely with test conditions and manufacturer specs, base your actual design on measured V-I curves for the specific stack.
2. In the field, “fuel cell alone vs battery alone” is a comparison that doesn’t hold up
Here is the point worth stressing in this article. Most comparison material puts the two technologies side by side as if they were equal alternatives, but from a field engineer’s perspective, the battery has already found its way into fuel-cell systems.
A fuel cell behaves more like a current source than a voltage source. As load increases, cell voltage sags noticeably, because it cannot keep pace instantly with load steps due to the response time of the air supply and thermal management systems. It simply cannot handle a step-load event lasting tens of milliseconds — the kind seen in motor start-up or server load transients — on its own.
So in practice the architecture is invariably a hybrid: stack + DC-DC converter + buffer battery (or supercapacitor). The stack carries the average power; the battery handles peak power and regeneration. The real comparison, then, is not “fuel cell vs battery” — it is “small battery + hydrogen tank” vs “large battery.” Reframed this way, the judgment becomes much simpler.
3. Where each wins — and where it doesn’t
Where the hydrogen fuel cell wins
Current conditions — loads such as large commercial vehicles, ships, and remote telecom stations that need large energy amounts and have severely limited opportunities to recharge. Building this out with batteries alone means pack mass eats into payload, and grid-import capacity has to keep scaling up just to recharge.
What changes when adopted — moving the storage medium to hydrogen means the added energy is reflected only in tank volume, while the output-side spec stays unchanged. Operating time can be extended without increasing grid-import capacity.
The connecting logic — past the point where the benefit of avoiding mass and grid-import expansion outweighs the loss from 30% round-trip efficiency, the balance tips in hydrogen’s favor. That boundary sits at roughly 4 hours of continuous discharge.
Where the hydrogen fuel cell loses
Current conditions — loads that charge and discharge daily in short cycles, such as passenger EVs, residential ESS, or frequency-regulation duty.
What changes when adopted — the more cycles repeat, the more the round-trip-efficiency loss accumulates, and operating cost climbs linearly. On top of that, compressor parasitic load and hydrogen-refueling infrastructure density become additional problems.
The connecting logic — in this regime, the 3–5 minute refuel advantage shrinks to a once-a-day convenience, while the efficiency loss stacks up every single cycle. Convenience is a constant; the loss is cumulative.
4. Safety interlock — protect the wiring order
Any article dealing with a hydrogen system has to define the interlock conditions up front. At minimum:
- On an H2 gas-detector warning (typically 25% of the lower explosive limit), main-breaker trip fires first
- Stack load is cut only after receiving the confirmed main-breaker-trip signal (contactor opens)
- Interlock on the forced-ventilation-fan run and airflow-confirmation signal
- The EMO circuit is hardwired. Bypassing it with software logic is prohibited. It is not an emergency circuit that depends on PLC scan timing
If the order is reversed and load is cut first, a window opens where residual hydrogen remains in the piping with only the detector-alarm state to rely on. The breaker comes first.
5. Boundary condition — where the conclusion flips
The judgment above holds only where grid connection is available and charge/discharge repeats at least once a day. Under the following conditions, the conclusion flips:
- Remote loads where grid import is impossible or capacity-expansion cost is excessive
- Continuous discharge requirements running past 4 hours, with backup capacity needed for post-discharge standby beyond a week (favors the side without self-discharge)
- Cases where curtailed renewable power would otherwise be wasted due to grid constraints — here the opportunity cost of the input power approaches zero, so the 30% round-trip efficiency stops acting as a penalty
If you keep only one single selection criterion, make it this: does the continuous discharge requirement exceed 4 hours? Below that line, the battery; above it — and where recharge opportunity is scarce — hydrogen.
Field checkpoints
- When evaluating fuel-cell selection, first require the stack manufacturer’s V-I curve and load-step response time (ms). Without these two figures, the DC-DC converter and buffer-battery capacity cannot be sized
- Calculate round-trip efficiency as the full chain from electrolysis through to the load, not as stack efficiency alone
- Route hydrogen-leak and ventilation signals into hardwired interlocks ahead of the PLC input