Bottom line first. Curtailment of Australia’s large-scale solar fell from about 18% in August 2025 to about 9% in August 2026, and the same month set solar generation records in three states. Less curtailment alongside more generation means the grid’s absorption capacity grew faster than installed capacity, but the report does not explain why curtailment fell. To read this figure properly from the equipment side, curtailment has to be broken down into transmission-constrained, economic and system-security types; concluding without that breakdown that “more storage cut curtailment” is premature. Whatever the cause, one thing is clear: the curtailment rate is a function of grid conditions, not installed capacity.
What was reported
On September 7, pv magazine cited Rystad Energy analysis of Australia’s large-scale solar in August. August 2026 solar generation set state records in New South Wales (684 GWh), Queensland (665 GWh) and Victoria (213 GWh). Combined utility-scale solar and wind generation was 4.99 TWh, up 3% from 4.86 TWh a year earlier.
The curtailment figures: utility-scale solar curtailment was 168 GWh in August 2026, about 9% of available generation, against 284 GWh or about 18% in August 2025, a drop of 116 GWh in a year. The article highlighted Queensland performers: Pacific Blue’s Haughton solar farm (100 MW, 28% capacity factor), Edenvale Solar Park (204 MW, 28% capacity factor) and Genex Power’s Kidston project (50 MW).
Projects that recently reached financial close were also listed: Edify Energy’s 300 MW of solar with 1,200 MWh of storage, BW ESS’s Yanco battery at 250 MW / 1,000 MWh, and Quinbrook’s Supernode Stage 3 at 260 MW / 1,216 MWh. The article did not, however, link the fall in curtailment to these projects or to transmission, demand or weather factors.
Available generation back-calculated from the report
Available generation can be back-calculated from the curtailment volume and rate. The formula is “curtailed energy ÷ rate”; since the rates were reported as approximate, the results are approximate too.
| Item | August 2025 | August 2026 |
|---|---|---|
| Curtailed energy | 284 GWh | 168 GWh |
| Curtailment rate | approx. 18% | approx. 9% |
| Available generation (derived) | approx. 1,578 GWh | approx. 1,867 GWh |
| Delivered generation (derived) | approx. 1,294 GWh | approx. 1,699 GWh |
By this back-calculation, available generation rose about 18% while the solar energy actually delivered to the grid rose about 31%. Delivered energy growing faster than installed potential means the grid’s absorption capacity expanded over the same period. The original article, however, may not use exactly the same denominator for the 2025 figure of 18% as for 2026, so this calculation is used only to see the direction.
Where it wins, where it doesn’t
Current conditions
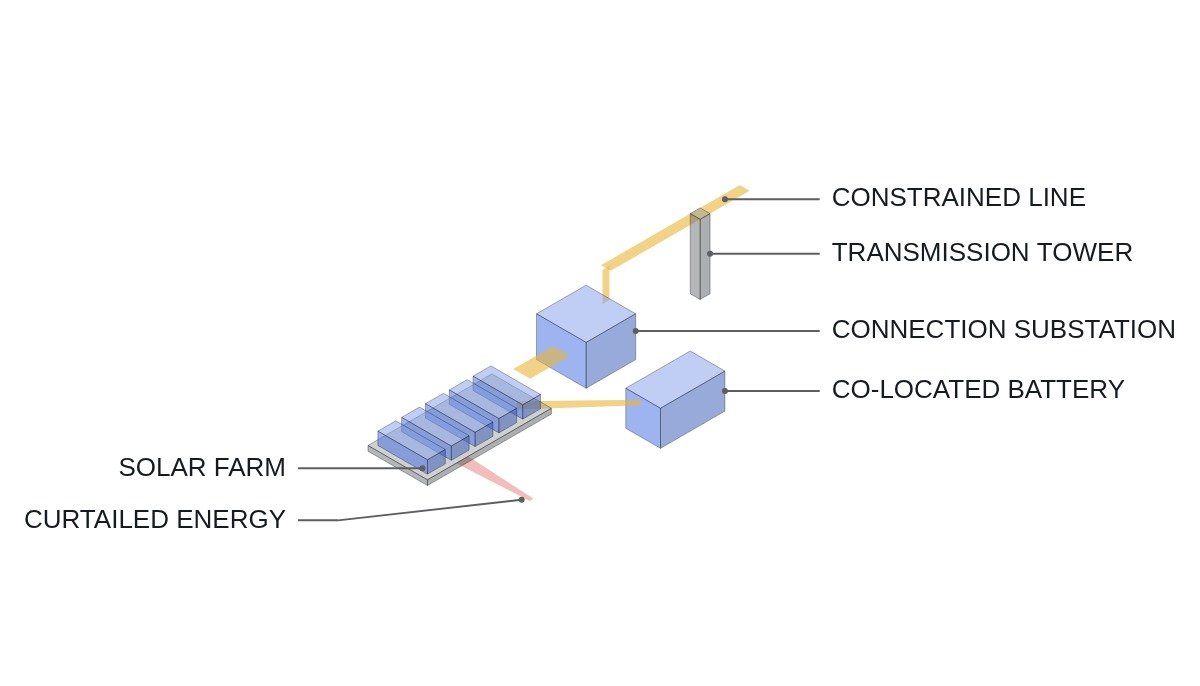
When large-scale solar clusters in one region, at midday either transmission capacity, local demand or system security limits bind first. Plants reduce output by as much as the binding limit requires, and in negative-price hours generators also cut output themselves. Curtailment of 18% means almost one-fifth of available generation was discarded.
After absorption capacity expands
Whether through transmission upgrades, added storage or demand growth, anything that raises the midday absorption ceiling reduces the energy discarded from the same fleet. Halving the curtailment rate directly improves a plant’s annual energy sales and revenue. That every project reaching financial close includes storage shows a trend of building absorption capacity into the project at the development stage.
The connecting logic
The discharge durations of the three storage projects are Edify 1,200 ÷ 300 = 4 hours, Yanco 1,000 ÷ 250 = 4 hours, and Supernode 1,216 ÷ 260 ≈ 4.7 hours. All are designed at around 4 hours, suited to shifting midday surplus into the evening peak. Once these assets operate, the “few hours of midday surplus” part of curtailment should fall, but how much they contributed to this drop cannot be confirmed from the report.
| Curtailment type | Occurs when | Remedies |
|---|---|---|
| Transmission-constrained | Line/substation capacity limit | Transmission upgrades, storage near the plant |
| Economic | Negative-price hours | Storage, demand shifting, contract structure |
| System security | Low inertia / system strength | Synchronous condensers, grid-forming inverters |
| Demand-driven | Surplus in light-load hours | Storage, load growth |
This table matters because each type has a different remedy. Transmission-constrained curtailment does not fall if storage is added nationwide but none sits in the constrained section, and system-security curtailment falls only with equipment that strengthens the grid, not with storage capacity (MWh). A single curtailment rate cannot tell which investment worked.
Decision sequence for generators elsewhere
- Break down curtailment history: classify your plant’s curtailment instructions by reason (transmission, supply-demand, security) and log them.
- Compare capacity factors carefully: the 28% capacity factor of the Queensland plants reflects Australian irradiance. Do not compare it directly with other sites; calculate losses from the difference in capacity factor with and without curtailment.
- Set storage duration: set the discharge duration of co-located storage by how many hours a day midday curtailment lasts. Four hours is the Australian example, not a reference value.
- Check grid location: confirm whether the connection substation sits in a transmission-constrained section. If it does, storage has to be on the plant side to help.
- Check inverter capability: where system-security constraints are expected, look first at the inverters’ fault ride-through and reactive power performance. Actual impact requires waveform analysis and field measurement.
Boundary conditions
Using these figures as evidence that “storage and grid investment cut curtailment” weakens under the following conditions. First, when August weather or demand differed significantly from the previous year; a single-month comparison cannot filter out seasonal and weather effects. Second, when the fall came from a one-off event in a specific region, such as a transmission upgrade; the same effect cannot then be expected elsewhere. Third, when new solar keeps growing and overtakes the expansion of absorption capacity again. The curtailment rate is the outcome of a race between capacity growth and grid expansion, and it can rise again at any time.
The single decision rule is this: choose curtailment remedies starting with the equipment that reduces the largest type of curtailment in a breakdown by reason, not the overall rate.
References
- pv magazine, “Australia’s large-scale solar hits new state records as curtailment falls”, 2026-09-07, https://www.pv-magazine.com/2026/09/07/large-scale-solar-hits-state-highs-as-curtailment-drops/