Module prices have already come close to international levels, but as long as system costs such as permitting, grid connection and land offset the fall in hardware prices, Korea’s solar LCOE will stay at around twice the level seen abroad. Standardising grid connection procedures and easing siting regulations have to come first for the gap to narrow.
Where it wins: conditions that lower system costs
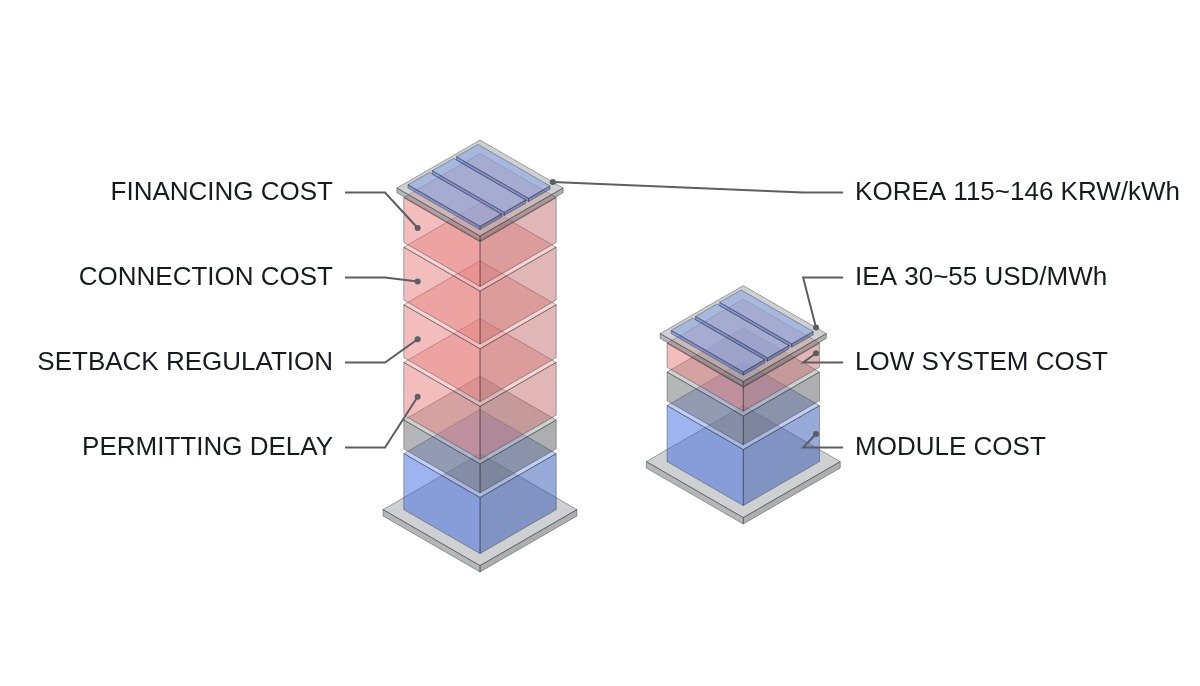
Korea’s solar LCOE is around KRW 115-146 per kWh, roughly twice the international benchmarks from the IEA, IRENA, Lazard and others. Most of the gap comes not from modules but from system costs such as permitting time, setback regulations and waiting time for grid connection. As procedures are standardised, for example the grid code expert committee starting trading under the quasi-central dispatch scheme (renewable type) from September 1 and the opening of Jeju’s distribution network flexibility market, these system cost items shrink and the LCOE gap narrows with them.
Where it doesn’t: conditions that lock system costs in place
If setback regulations and permitting times stay as they are, Korea’s LCOE will remain high relative to other countries no matter how far module prices fall. The fact that the solar auction price cap in July 2026 formed in the KRW 140 range is a signal that system costs are still being passed straight into prices.
Comparison table
| Source/region | LCOE range | Notes |
|---|---|---|
| Korea (KEEI) | KRW 115-146/kWh | Includes building, agrivoltaic and floating |
| IEA | USD 30-55/MWh | International average |
| IRENA | USD 44/MWh | International average |
| Lazard | USD 40-61/MWh | US basis |
The takeaway from the comparison table is that module prices have already converged internationally, and the gap that remains is purely procedural and regulatory cost.
Where system costs pile up
When we say the LCOE gap is caused by system costs rather than modules, that system cost is not a single item but an overlap of costs with different characters. Different characters call for different ways of reducing them, so lumping them together leads to misreading the room for improvement.
| Cost type | Typical items | Condition for reduction |
|---|---|---|
| Time cost | Permitting period, grid connection wait | Standardised procedures and stated processing deadlines |
| Space cost | Setback regulations, land lease | Eased siting rules, alternative sites such as buildings and water surfaces |
| Connection cost | Line reinforcement, substation cost sharing | Choosing regions with spare grid capacity |
| Financing cost | Interest during construction | Falls along with the three items above |
What this table says is that financing cost is not an independent item but a result of the three items above it. The longer permitting and grid connection waits run, the longer capital stays tied up, and the more cost accumulates before generation starts. That is why shortening procedures reduces time cost and financing cost at the same time.
Why it has to be viewed region by region
Of the four items above, connection cost is the one where a national average means almost nothing. For the same capacity, a project in a region with spare grid capacity simply connects to an existing line, while in a saturated region line reinforcement or substation expansion comes attached. This difference arises regardless of the generating technology’s performance and lies outside what a developer can reduce through design.
So when comparing Korea’s LCOE with international averages, first make sure you are comparing like with like. International LCOE figures are usually calculated assuming large sites with good connection conditions. Korea’s figures, by contrast, include building-mounted, agrivoltaic and floating types, and the forms with heavy site constraints pull the average up. Without accounting for this difference in composition, you end up explaining the gap by procedural cost alone.
Indicators that confirm the gap is narrowing
- Average time from grid connection application to connection — represents both time cost and financing cost.
- The spread between the auction price cap and winning bids — if system costs actually come down, this spread moves first.
- Whether regional spare grid capacity is disclosed — determines whether connection cost can be calculated in advance.
Of the three indicators, the first is the most direct, but it is hard to track from public statistics. The second is published with auction results, so in the short term it is more realistic to use it as a proxy. That said, winning bids mix in each developer’s financing terms, so system cost cannot be isolated on its own.
In short, what determines the size of the gap is not hardware but procedure, and within procedure, connection conditions that differ by region. The national average LCOE can serve as an indicator for policy discussion, but it cannot be used as is to judge the economics of an individual project.
One more point: all three indicators are lagging indicators. To gauge the gap before starting a project, there is no alternative to checking the grid connection application status and the setback ordinances of the region directly.
Boundary conditions
If module prices fall sharply again or Korea’s permitting period is cut dramatically, the gap could close faster than expected. Conversely, in regions where grid connection waits actually get longer, the gap could widen, so regional spare grid capacity has to be checked alongside, not the national average.
References
- Renewable energy LCOE statistics – Korea Energy Statistics Information System (Korean)
- Wind and solar generation costs with system costs included – Segye Ilbo (Korean)
- ENCORED Newsletter, August 2026 (Korean)