Bottom line first. The method that measures battery SOH (State of Health) closest to its definition is the capacity test; DC internal resistance (DCIR) and electrochemical impedance spectroscopy (EIS) are proxies. Proxies are fast and do not require stopping operation, but their values drift unless temperature, SOC and measurement conditions are held fixed. So use capacity tests where residual value must be settled (second-life trades, warranty decisions), DCIR for in-service trend monitoring, and EIS where degradation causes need to be separated. Before choosing a method, decide whether the asset’s bottleneck is capacity or resistance.
Where it wins, where it doesn’t
Current condition
In the field, SOH is often taken as a single percentage on the BMS screen. Few ask what it was calculated from, whether it is capacity-based or resistance-based, or when it was last recalibrated. The same cell can show different values depending on the BMS algorithm and the last calibration point.
After the change
Split SOH into two indicators and the picture sharpens. Capacity SOH is present dischargeable capacity divided by rated capacity; it says how much energy the battery can hold. Resistance SOH is how far internal resistance has risen from its initial value; it says how much power the battery can deliver in a short burst. The two tend to worsen together, but not at the same rate.
Connecting logic
The choice of method therefore starts from the application’s bottleneck. Energy-shifting ESS that draws energy over several hours is capacity-limited; frequency-regulation ESS and UPS that deliver large power for short periods are resistance-limited. If resistance has risen so far that the power requirement can no longer be met, the battery has reached end of life for that asset even with plenty of capacity left, and the reverse also holds. The method that measures the bottleneck indicator directly becomes the reference measurement for that asset.
Method comparison
| Item | Capacity test | DCIR | EIS |
|---|---|---|---|
| Measures | Dischargeable capacity | Resistance from pulse voltage drop | Impedance by frequency |
| Relation to SOH | The definition itself (capacity SOH) | Resistance SOH directly | Proxy, separates causes |
| Duration | Several hours or more | Pulse of seconds | Sweep of minutes |
| Operation stop | Required | Possible in service | Rest state recommended |
| Sensitive to | Temperature, discharge rate | Temperature, SOC, pulse width | Temperature, SOC, rest time |
| Equipment | Cycler | BMS current and voltage sensing | Impedance analyzer |
| Main use | Settling residual value | In-service trend monitoring | Diagnosing degradation cause |
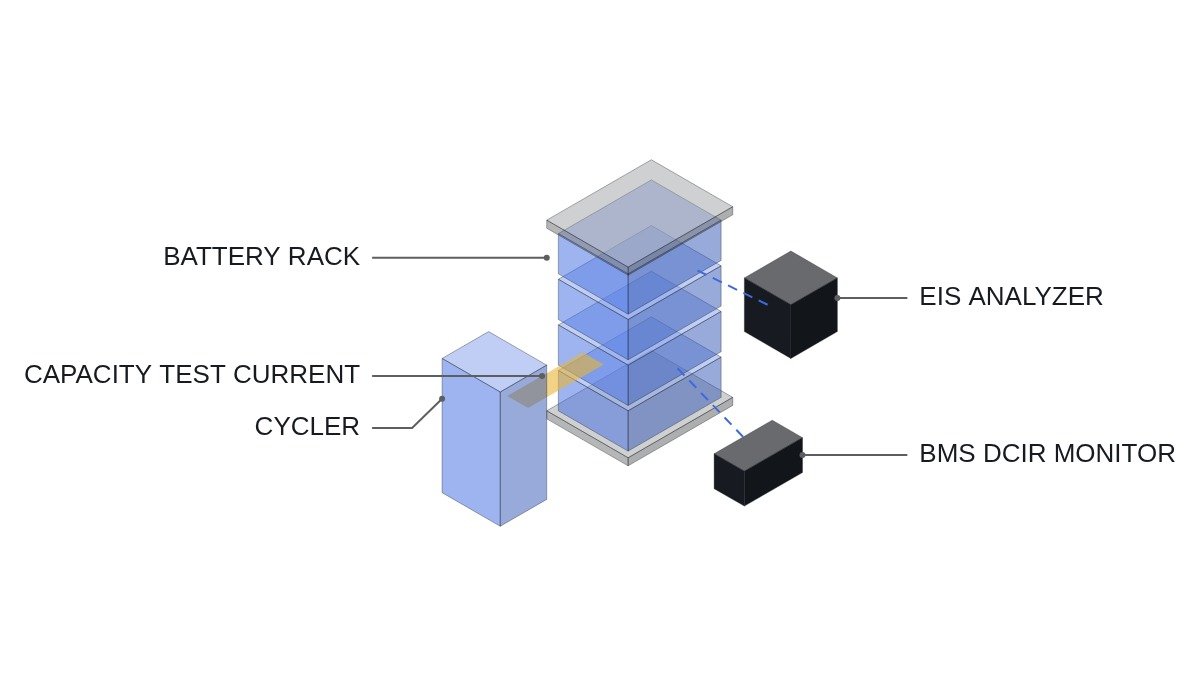
The three methods are not substitutes; they are tools with different jobs. The capacity test is slow but gives the reference value; DCIR and EIS are fast but only mean something once calibrated against that reference. In practice the most common setup uses periodic capacity tests as calibration points and bridges the gaps with DCIR trends.
Practical notes by method
Capacity test
A capacity test fully charges the cell, discharges it at a set rate down to the cut-off voltage, and integrates the charge. Assumption: a 100Ah cell at 0.2C takes five hours for the discharge alone; add the charge before and after plus rest periods and one test easily exceeds ten hours. The test itself consumes a cycle and requires the asset to stop, so it cannot be run often on an operating ESS. Unless discharge rate and temperature are kept identical each time, comparisons between tests are meaningless. Use cell performance test standards such as IEC 62660-1 as the procedural reference.
DCIR
DCIR is the change in voltage divided by the change in current when a current pulse is applied (R = ΔV / ΔI). For the same cell, a short pulse gives a value dominated by the ohmic component, and a long pulse includes diffusion as well. Changing the pulse width means measuring a different physical quantity, so trend monitoring should compare only values taken with fixed pulse width, SOC and temperature. In-service load changes can be used as pulses, but then the condition-filtering logic determines measurement accuracy.
EIS
EIS applies a small AC signal across a range of frequencies and measures the response to obtain an impedance spectrum. It separates ohmic resistance at high frequency, the charge-transfer semicircle at mid frequency, and diffusion behavior at low frequency, which makes it strong at telling which degradation is under way. On the other hand, the cell must rest long enough to approach equilibrium, and the small measurement signal is susceptible to noise from nearby power converters. Measurement reliability in a field installation requires waveform analysis and field measurement.
BMS-reported SOH
The SOH the BMS shows is usually estimated from operating data, for example by estimating capacity from the ratio of integrated charge to SOC change during charging, or resistance from the voltage response to load changes. These estimates inherit errors from SOC estimation and current sensing, and drift from reality as calibration ages. Grading second-life batteries on the BMS value alone passes that error straight into the transaction price. Use the reported value as a trend reference and settle with the reference measurement.
Decision sequence
- Set the bottleneck indicator from the asset’s application: capacity for energy duty, resistance for power duty.
- If residual value or warranty decisions are at stake, designate the capacity test as the reference measurement.
- Build in-service monitoring on DCIR trends, with pulse width, SOC window and temperature conditions fixed in writing.
- If the DCIR trend jumps or cell-to-cell spread widens, use EIS to separate causes.
- Recalibrate DCIR trends and BMS-reported SOH with periodic capacity test results.
Skip step 5 and the other four steps all drift. DCIR trends and BMS values tend to wander from the reference over time, so operating without the capacity test as a calibration point leaves you, a few years on, unsure what your judgments are based on. Set the calibration interval in advance and tie it to planned outages.
Boundary conditions
This allocation shifts under some conditions. First, on assets that cannot be stopped, capacity tests cannot be run at asset level, so you test sample cells or a spare rack and extrapolate to the whole. The difference in temperature history between samples and operating cells becomes an error source. Second, cells with flat voltage curves such as LFP make it hard to estimate capacity from partial-discharge data, which increases the weight of capacity testing. Third, EIS interpretation depends on the equivalent-circuit model chosen, so it is more reliable for comparing the same cell over time than as an absolute value.
Fourth, cell-level SOH and pack-level SOH differ. Usable pack capacity is tied to the worst cell, so a pack with high average cell SOH but wide spread will show low pack SOH. A capacity test at rack or pack level captures real usable value including that spread effect, while cell sampling may show only the average. When settling residual value, first agree in writing which level of SOH is the contractual basis; that alone prevents many disputes.
The single selection rule: make the method that directly measures the asset’s bottleneck indicator the reference measurement, and use proxies (DCIR, EIS) to fill the gaps only when that reference cannot be measured often.